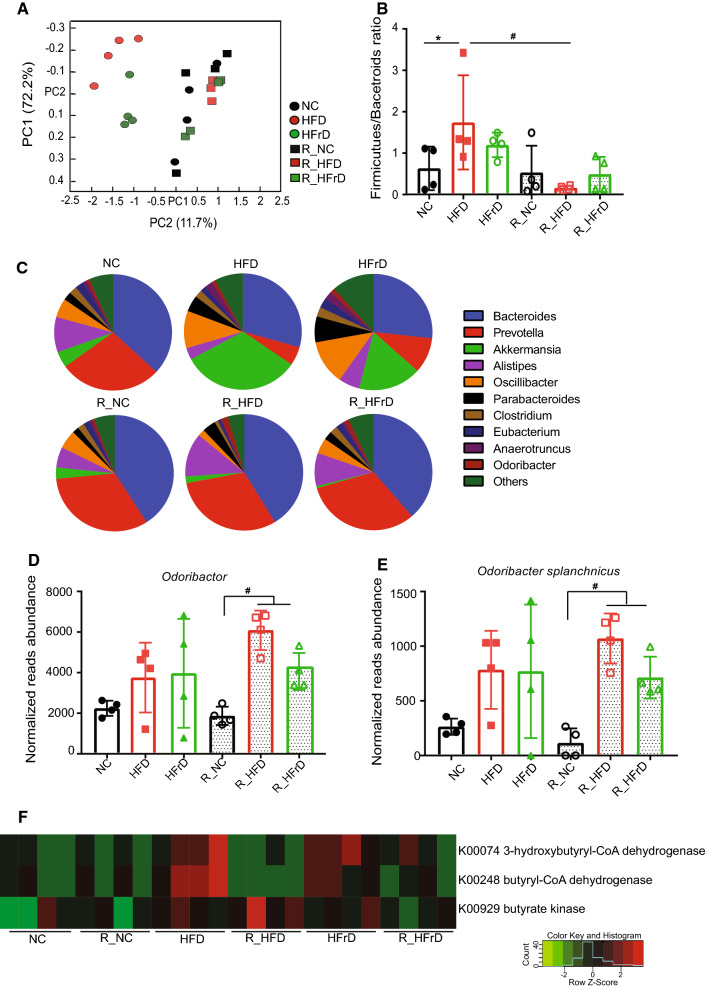
Fig. 2.
Dietary changes induced significant changes in gut microbiome. (n = 4 mice per group). a PCA plot shows principle gut components after dietary changes and return to NC. bFirmicutes/Bacteroides ratios in dietary groups. *P < 0.05 for NC vs. HFD, #P < 0.05 for HFD vs. R_HFD, one-way ANOVA. c Pie chart shows microbiome composition and relative abundances of each species for each diet group. Normalized abundances of dOdoribacter; #P < 0.05 for R_NC vs. R_HFD or R_HFrD, one-way ANOVA and eOdoribacter splanchnicus; #P < 0.05 for R_NC vs. R_HFD or R_HFrD, one-way ANOVA. f Heatmap shows differential expression of butyrate synthesis-related enzymes, identified with KEGG pathways analysis

