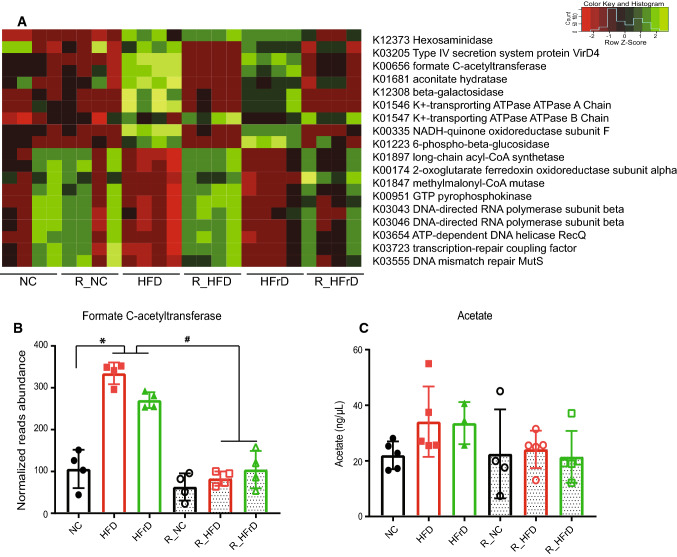
Fig. 3.
Dietary changes induced changes in expression of genes related to metabolism. (n = 4 mice per group). a Heatmap shows differential expression of genes related to metabolism, identified in KEGG pathways analyses. b Normalized reads show abundance of formate C-acetyltransferase. *P < 0.05 for NC vs. HFD or HFrD, #P < 0.05 for HFD vs. R_HFD and HFD vs. R_HFrD, one-way ANOVA. c Serum acetate changes with diet

