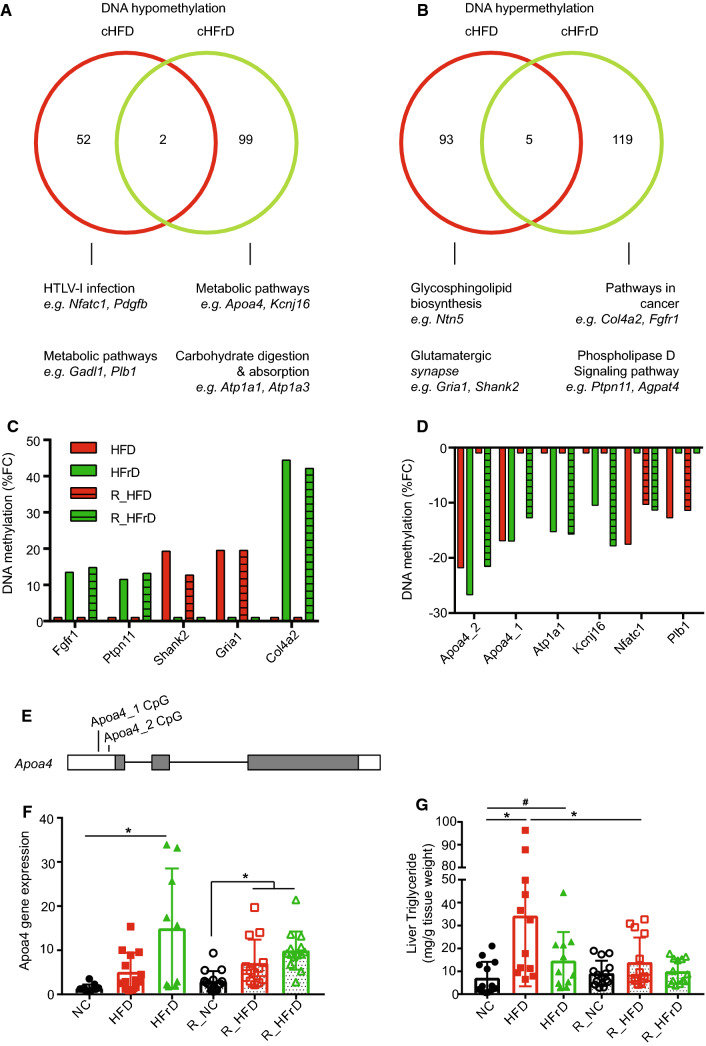
Fig. 5.
Analysis of differential promoter methylation induced by diets. We applied a cutoff of ± 10% change in methylation and an adjusted P value of q ≤0.05. Methylation changes compared between HFD and R_HFD are termed cHFD; changes between HFrD and R_HFrD are termed cHFrD. a Venn diagram shows promoter CpG hypomethylation in cHFD (red) and cHFrD (green) and shared genes (n = 2); b Venn diagram shows promoter CpG hypermethylation on promoters for cHFD and cHFrD and shared genes (n = 5). (a, b, lower panels) Top KEGG pathways are shown for the promoters, where dmCpGs were found for cHFD and cHFrD. Fractional changes (FC) in the % methylation in a short list of c hypomethylated promoters and d hypermethylated promoters, selected based on relevance in KEGG pathways analyses. e Genomic diagram of the Apoa4 gene shows the locations of two hypomethylation sites; white bars indicate UTRs; grey bars indicate protein-coding exons. f Changes in Apoa4 gene expression with diets, measured with quantitative RT-PCR, and normalized to housekeeping gene expression levels. *P ≤ 0.05 for NC vs. HFrD, R_NC vs. R_HFD or R_HFrD, one-way ANOVA (n = 9–13 mice per group), g Triglyceride level in liver tissue. *P≤0.05 for NC vs. HFD, HFD vs. R_HFD, one-way ANOVA. #P≤0.05 NC vs. HFrD, t test (n = 12–16 mice per group)

