Fig. 1.
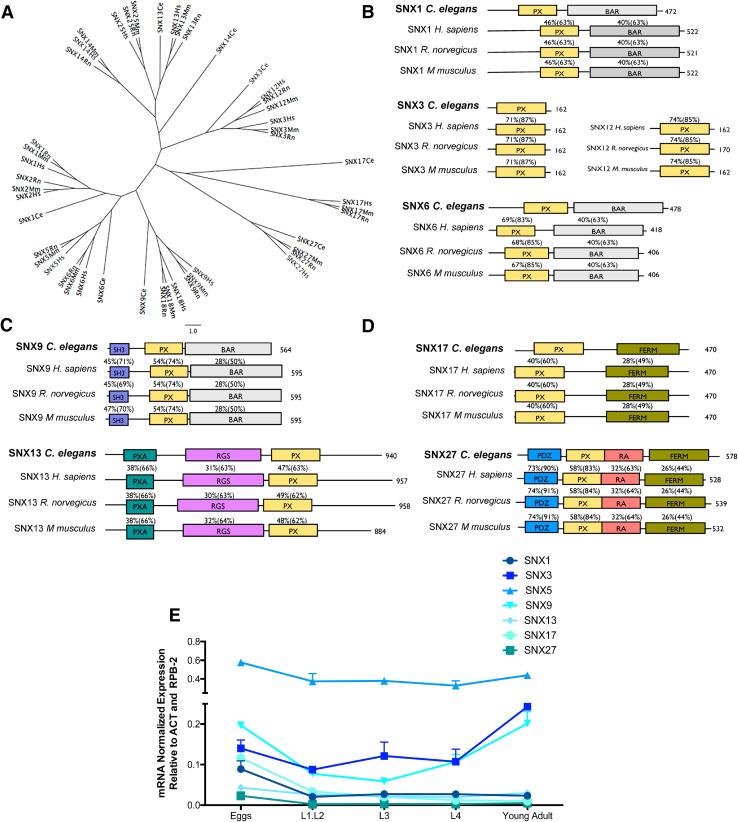
Phylogenetic analysis of SNXs orthologs and their developmental expression in C. elegans. a Unrooted tree representing the phylogenetic relationship between SNX orthologs. The corresponding aminoacidic sequences were analyzed using ClustalW for sequence alignment and PHYLIP for tree plotting. b–d Representation of C. elegans SNXs domain structure and their mammalian orthologs. The percentage of amino acid identity and (similarity) between C. elegans protein sequences and its mammalian homologs is also represented. PX phox homology, BAR Bin-amphiphysin-Rvs, SH3 Src homology, PXA PX-associated domain, RGS regulators of G protein signaling, FERM F for 4.1 protein, E for ezrin, R for radixin and M for moesin, PDZ P for post-synaptic density protein (PSD95), D for drosophila disc large tumor suppressor (Dlg1), and Z for zonula occludens-1 protein (zo-1), RA Ras-association. e qRT-PCR expression analysis of distinct SNXs during development is represented in function of the developmental stage. SNXs are strongly expressed in the egg and adult stages and SNX5 is the most expressed SNX throughout C. elegans development. Independent experiments were performed with n > 200 per developmental stage. One-way ANOVA was performed and data represented are mean ± SD *p < 0.05; **p < 0.01; ***p < 0.001). Statistical analysis demonstrated that during the embryonic stage the expression of snx-1 is distinct from snx-5 and snx-9 (p < 0.00; p = 0.026, respectively); snx-3 expression is distinct from snx-5, snx-13 and snx-27 expression levels (p < 0.000, p = 0.048, p = 0.16, respectively); snx-5 expression is distinct from all tested SNXs (p < 0.000); snx-9 expression is distinct from snx-1, snx-5, snx-13 and snx-27 expression levels (p = 0.026, p < 0.001, p = 0.003 and p = 0.001 respectively); snx-13 expression is distinct from snx-3, snx-5 and snx-9 expression levels (p = 0.048, p < 0.001, p = 0.003, respectively); snx-17 expression is distinct from snx-5 (p < 0.000); and snx-27 expression is distinct from snx-3, snx-5 and snx-9 (p = 0.016, p < 0.001, p = 0.001, respectively). During the L1.L2 phase, SNXs expression differs significantly between each other [F(6,7) = 31.21 p < 0.001]. A post-hoc comparison indicates that snx-5 expression is significantly different from all others (p ≤ 0.001 for all). On the L3 phase SNXs expression also differs significantly between each other [F(6,7) = 158.91 p < 0.001]. Post-hoc analysis indicates that snx-3 and snx-5 expression levels are statistically different from all other SNXs (snx-3:0.087 > p ≤ 0.001; snx-5 p ≤ 0.001 for all). Regarding the L4 stage, SNXs expression is also distinct between each other [F(6,7) = 46.88, p < 0.001]. Post-hoc analysis indicates that only snx-5 expression differs significantly from all other SNXs (p ≤ 0.001 for all). On the adult phase SNXs expression also differs [F(6,7) = 276.50, p < 0.001], with the post-hoc analysis confirming that snx-3, snx-5, and snx-9 differ from all others, and with each other (p < 0.001)

