Fig. 4.
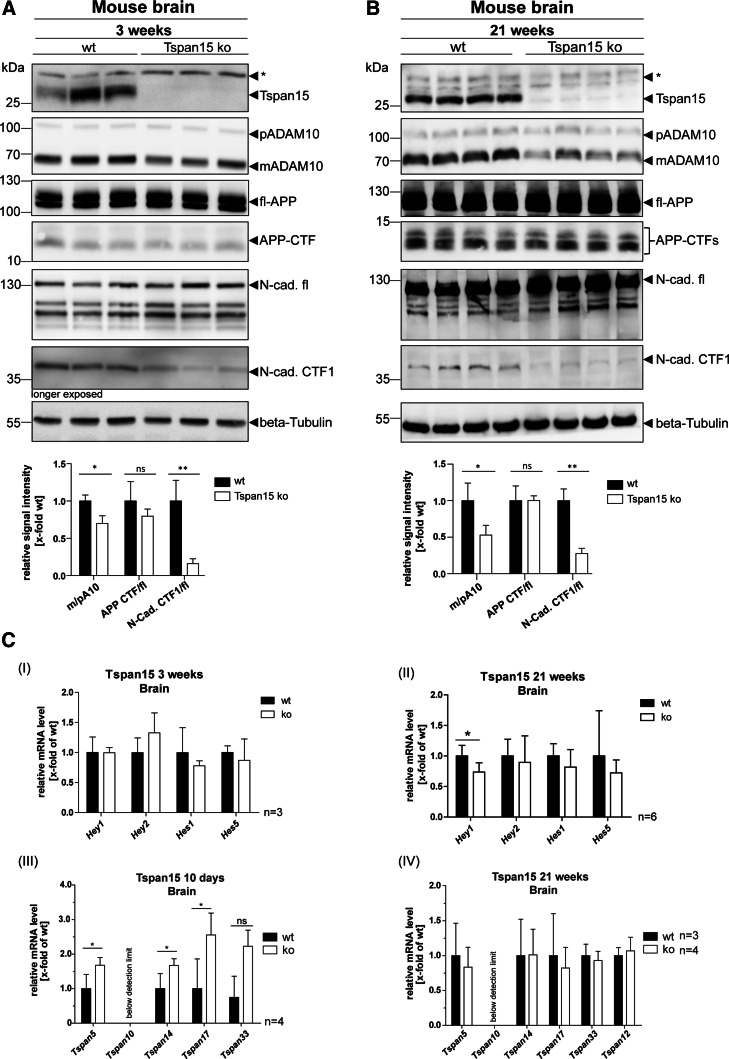
Loss of Tspan15 reduces ADAM10 maturation and N-cadherin shedding. Brain homogenates of a 3-week-old and b 21-week-old wild-type (wt) and Tspan15 knockout (ko) mice were prepared and analyzed by immunoblot. Tspan15-deficiency in Tspan15 ko samples was confirmed by the absence of specific signals after staining with an anti-Tspan15 antibody (Tspan15 T2EL). Using an anti-ADAM10 antibody (ADAM10 EPR5622) expression of pro- (p) and mature (m) ADAM10 was detected in all samples. Compared to respective wild-type samples, expression of mADAM10 was clearly reduced in 3-week-old (a) and 21-week-old (b) Tspan15 knockout mice. Staining for APP with a C-terminal anti-APP antibody revealed no differences between Tspan15 knockout and wild-type mice (a + b) in the expression of full-length (fl-) APP and the APP-C-terminal fragment (CTF). Expression of full-length N-cadherin (N-cad.-fl) and the C-terminal fragment CTF1 generated by ADAM10 (N-cad. CTF1) was monitored with an anti-N-cadherin antibody. N-cadherin-CTF1 production was significantly reduced in 3-week-old (a) and 21-week-old (b) Tspan15 knockout mice compared to respective wild-type samples. Beta-Tubulin staining was used to control for equal protein loading. Asterisks (*) mark unspecific signals. Quantitative analysis was performed by calculation of relative signal intensities for ADAM10 (m/p), APP (CTF/fl), and N-cadherin (CTF1/fl). c (I–II) Tspan15-deficiency has only a minor effect on Notch downstream gene expression. To analyze the influence of the Tspan15 knockout on Notch shedding, the transcription level of Notch downstream genes Hey1, Hey2, Hes1, and Hes5 was analyzed in Tspan15 wild-type (wt) and knockout (ko) mice. mRNA was isolated from 3-week-old (a) and 21-week-old (b) animals. After reverse transcription into cDNA, relative mRNA levels were measured by qRT-PCR. ΔCt values were calculated and normalized to wild-type samples. (I) Loss of Tspan15 had no significant influence on the relative transcription levels of Hey1, Hey2, Hes1, and Hes5 in 3-week-old mice (n = 3). (II) In 21-week-old mice, Tspan15-deficiency only increased the relative mRNA level of Hey1 but had no effect on Hey2, Hes1, and Hes5 (n = 6). Statistical significance was tested using Student’s t test (*p < 0.05). (III–IV) Loss of Tspan15 in young mice increases transcription levels of other TspanC8 members. Relative transcription levels of TspanC8 tetraspanins 5, 10, 14, 17, and 33 were analyzed. mRNA was isolated from brains of 10-day-old (a) and 21-week-old (b) Tspan15 wild-type (wt) and knockout (ko) mice, reverse transcribed into cDNA, and TspanC8 transcription levels were measured by qRT-PCR. ΔCt values were calculated and normalized to wild-type samples. (III) The relative mRNA levels of Tspan5, 14, and 17, but not Tspan33, were significantly increased in 10-day-old Tspan15 ko mice compared to respective wt samples (n = 3). (IV) In 21-week-old mice, no significant differences in the transcription levels of the respective TspanC8 tetraspanins were observed between Tspan15 ko (n = 4) and wt (n = 3) mice. Tspan10 mRNA levels were below the detection limit (a + b). Values of wt samples were set to one and data are shown as mean values ± SD. Statistical significance was analyzed by Student’s t test (*p < 0.05, **p < 0.01)

