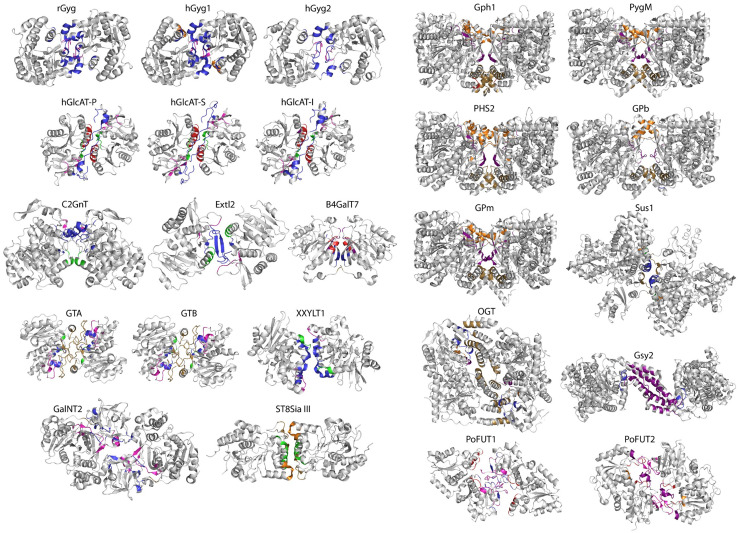
Fig. 1.
Ribbon drawings of the 24 GTase homodimeric structures comprising the research material of this study. All structures are presented in orientations which easily show the secondary structural elements in the dimer interface, with the location of interacting residues in those structural elements colour coded as follows: before β1 (brown), between β1 and β2 (red), between β2 and β3 (purple), between β3 and β4 (orange), β4′–βC/between β4 and β5 (green), between β5 and β6 (magenta), after β6 (blue). Each structure can be identified with the enzyme acronym; the same identification is used in Table 1 and in the text. GT-A fold and GT-A variant structures are on the left, while GT-B fold and GT-B variant structures are on the right

