Fig. 3.
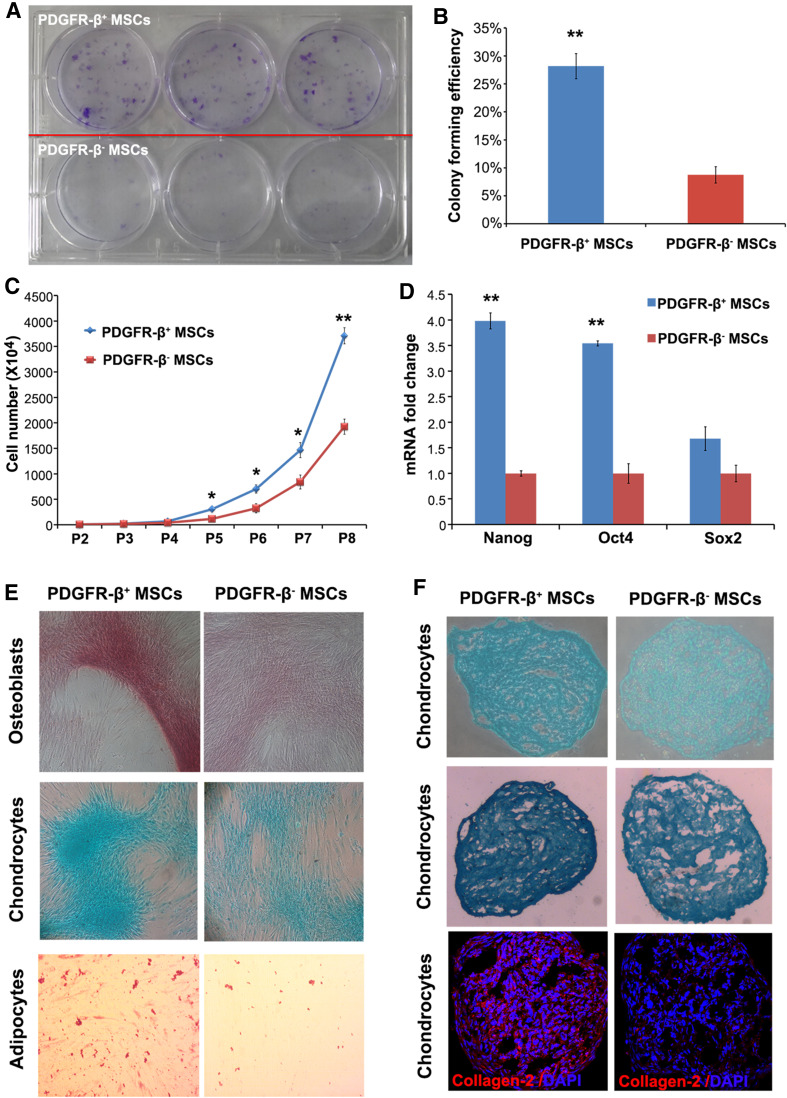
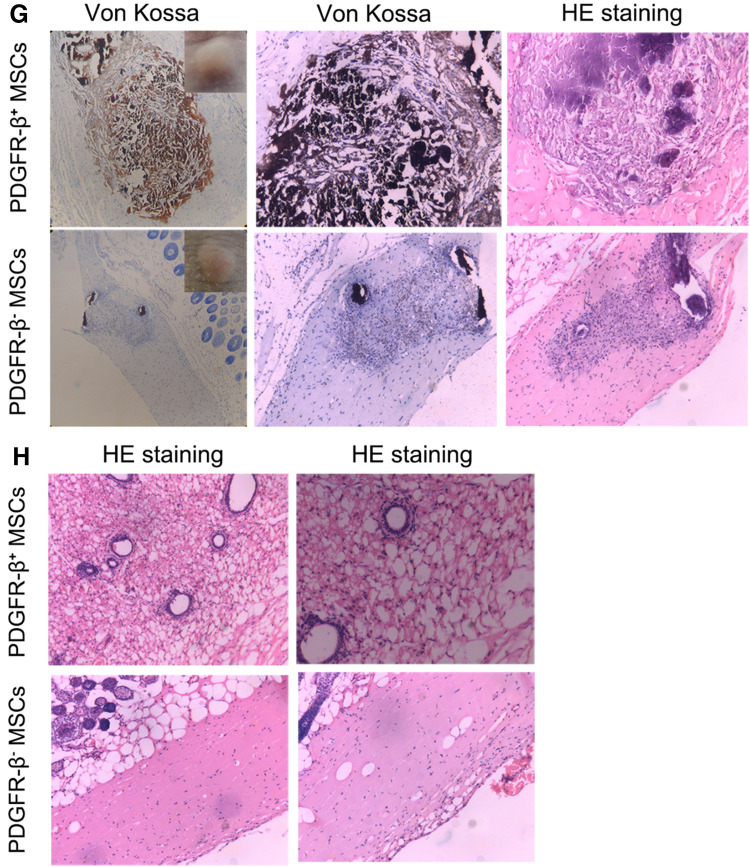
Multipotency of PDGFR-β+ MSCs. a, b PDGFR-β+ cells and PDGFR-β− cells were seeded, respectively, in six-well culture plate at a density of 200 cells per well and incubated for 14 days. Then the culture was fixed with 4% PFA and stained with crystal violet solution. Triplet wells were used for the assay (a). The number of colonies (diameter ≥2 mm) in each well was counted (b). c Growth curves of PDGFR-β+ cells and PDGFR-β− MSCs. d Real-time PCR analysis of the expression of Nanog, Oct4 and Sox2 in PDGFR-β+ and PDGFR-β− MSCs. e Differentiation of MSC. PDGFR-β+ MSCs and PDGFR-β− MSCs were examined for their differentiation into osteoblasts, chondrocytes and adipocytes in monolayer culture upon appropriate inductions. For osteogenic differentiation the culture was examined after Alizarin Red S stain; for chondrogenesis the culture was assessed after Alcian blue stain; for adipogenic differentiation the cells were analyzed after oil red stain. f Chondrogenesis in pellet culture was determined for their expression of proteoglycans after Alcian blue stain and their expression of collagen II after immunofluorescence stain. g, h In in vivo differentiation analysis, equal numbers of PDGFR-β+ or PDGFR-β− MSCs in Matrigel were implanted subcutaneously in nude mice (for osteogenesis BMP-2 was added to the implants, 2 μg/implant). After 28 days, the grafts were removed for histological analysis. In assessing osteogenesis, tissue sections were stained by Von Kossa and H&E (g, n = 4); adipogenesis in the grafts were determined for the presence of cells with adipocyte morphology after H&E stain (f, n = 4). ***P < 0.001, **P < 0.01, *P < 0.05


