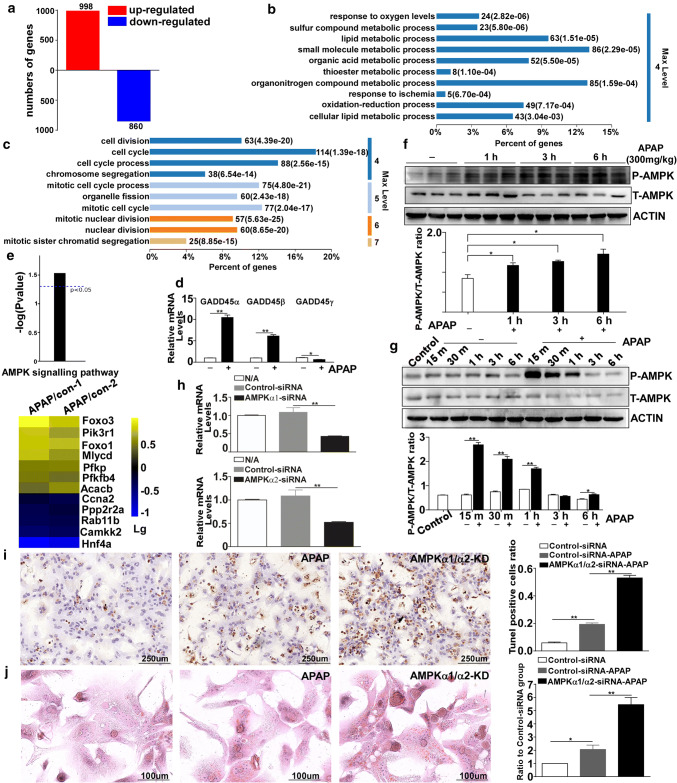
Fig. 3.
The AMPK pathway is activated after exposure to APAP. a Diagram illustrating the genes that were upregulated and downregulated at 6 h. b, c Significantly enriched biological process category in the gene ontology (GO) analysis concerning the genes that were upregulated or downregulated at 6 h after APAP treatment. d The mRNA expression levels of the GADD45 family members (GADD45α, GADD45β and GADD45γ). e Diagram displaying the activation of the AMPK signaling pathway and a heat map representing the log(10) fold change for the genes relating to the AMPK signaling pathway in the APAP treatment group compared with the control group. f Western blot analysis of P-AMPK and T-AMPK in the livers of C57BL/6J mice after treatment with 300 mg/kg APAP for different times. g The protein levels of P-AMPK and T-AMPK in AML-12 cells after APAP treatment for different times. h The mRNA expression levels of AMPKα1 and AMPKα2 in primary mouse hepatocytes after transfections with siRNA targeting AMPKα, confirming the knocking down of AMPKα. (i) TUNEL staining in primary mouse hepatocytes with AMPKα knockdown at 6 h after APAP treatment and the quantification of the number of TUNEL-positive cells. j Oil Red O staining of primary mouse hepatocytes with AMPKα knockdown at 6 h after APAP treatment and the quantification of the ratio relative to the control group. Data are expressed as the mean ± standard error of the mean. *P < 0.05, **P < 0.01

