Fig. 1.
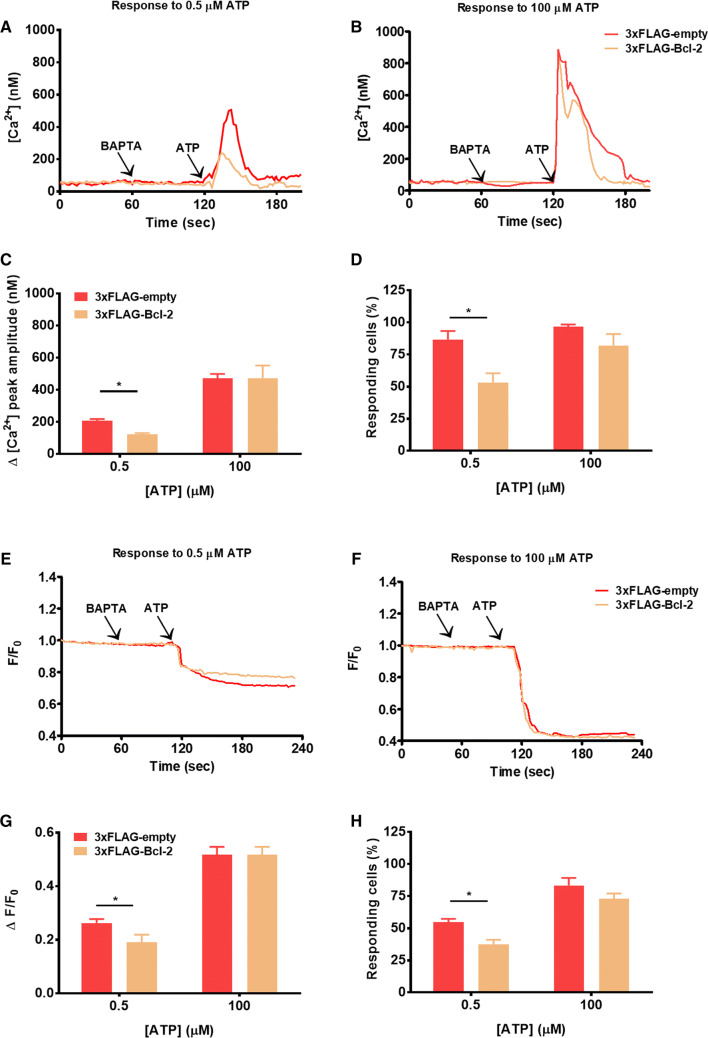
Cytosolic [Ca2+] rises triggered by submaximal, but not supramaximal concentration of the agonist, are suppressed by Bcl-2. a, b Cytosolic Ca2+ release in response to 0.5 (a) or 100 (b) μM ATP was measured in the mCherry-positive Fura-2-loaded COS-1 cells overexpressing 3xFLAG-empty vector or 3xFLAG-Bcl-2. The free extracellular Ca2+ was chelated by addition of 3 mM BAPTA. The obtained Fura-2 fluorescence signals (F340/F380) were calibrated and representative traces are plotted as [Ca2+]. c Quantitative analysis of the amplitude of the ATP-induced Ca2+ signals from at least three independent experiments, which were performed on different days after independent transfections (total number of cells for each [ATP] > 90) is plotted as mean ± SEM. d Quantitative analysis of the number of cells responding to the agonist. e, f Decrease in the ER Ca2+ content in response to 0.5 (e) or 100 (f) μM ATP was monitored using G-CEPIA1-ER in mCherry-positive COS-1 cells, overexpressing 3xFLAG-empty vector or 3xFLAG-Bcl-2. Extracellular Ca2+ was chelated by the addition of 3 mM BAPTA. Typical normalized (F/F0) traces of the obtained fluorescence signals are presented. g Quantitative analysis of the ER Ca2+ decrease in response to ATP. For each trace, the ATP-induced Ca2+ release was determined by subtracting the fluorescence after ATP addition (during plateau phase) from the fluorescence just before ATP addition after normalization. Values depict average ± SEM from at least three independent experiments, which were performed on different days after independent transfections (total number of cells for each [ATP] > 90). h Quantitative analysis of the number of cells responding to the agonist expressed as a % of the total number of measured cells. *Stands for p < 0.05

