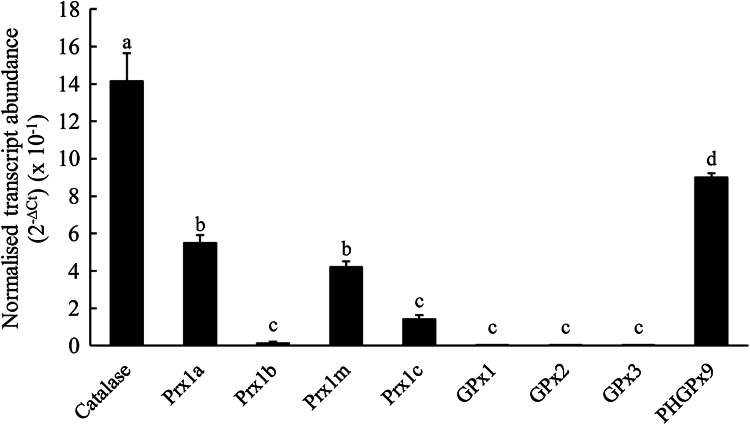
Fig. 5.
The expression of the Prx1 genes in T. thermophila compared with the one catalase gene, the three glutathione peroxidase (GPx) genes and one of the nine phospholipid hydroperoxide glutathione peroxidase (PHGPx) genes. The cells had been cultured under control conditions in SSP medium as described for their routine maintenance. The transcript abundances for the genes of interest have been normalized to the transcript abundance for GAPDH using the formula 2−∆Ct. The columns represent the means and the bars represent the standard errors of the means (n = 3). Different letters indicate statistically significant differences between the means (P < 0.05)

