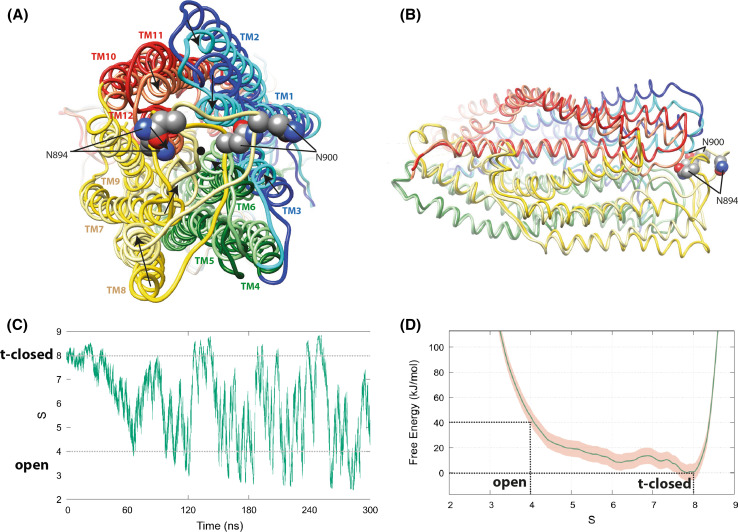
Fig. 1.
Models of the CFTR open and t-closed forms after metadynamics simulations. The initial metadynamics simulations were conducted with a CFTR sequence with a slight variation (D to N) in a non-conserved, likely non-critical position (249), but similar MD trajectories and reversible transition pathway were afterwards observed using the CFTR wild-type sequence. Coordinates of open and t-closed conformational states are provided for both simulations in our web site. a Superimposition (view from the extracellular side) of representative conformations of the open (dark colors) and t-closed (light colors) states after metadynamics simulations. Movements leading to the closure of the channel appear to be almost equally distributed on the upper parts of the TM helices TM1, TM2, TM3, TM6, TM7, TM8, TM11, and TM12, converging toward the pore center represented by a black dot. The asparagine N894 and N900 which are linked to glycans are highlighted. These positions suggest that glycans may be sometimes oriented toward the extracellular entrance of the pore. b Orthogonal view. For sake of clarity, the NBDs are not shown. The central and lower parts (ICLs, at left) of the TM helices are almost identical for the open and t-closed states (RMSD 1.83 Å for 405 superimposed Cα). c The progress along CFTR closure/opening pathway. The collective variable S is extracted from the metadynamics simulation and plotted in function of time. The variable tracks the similarity between each simulation snapshot and the reference configurations, using the mean-square deviation among interatomic distances on 65 alpha carbons from the upper part of the CFTR central TM helices (see “Materials and methods” section and Supplementary Table 2). d Free-energy surface F(S) from the metadynamics simulation. The profiles are obtained integrating the Z coordinate and averaging the bias potential in the 120–300 ns interval. The pink shaded region represents the deviation between F(S) profiles averaged in the 120–210 and 210–300 ns intervals

