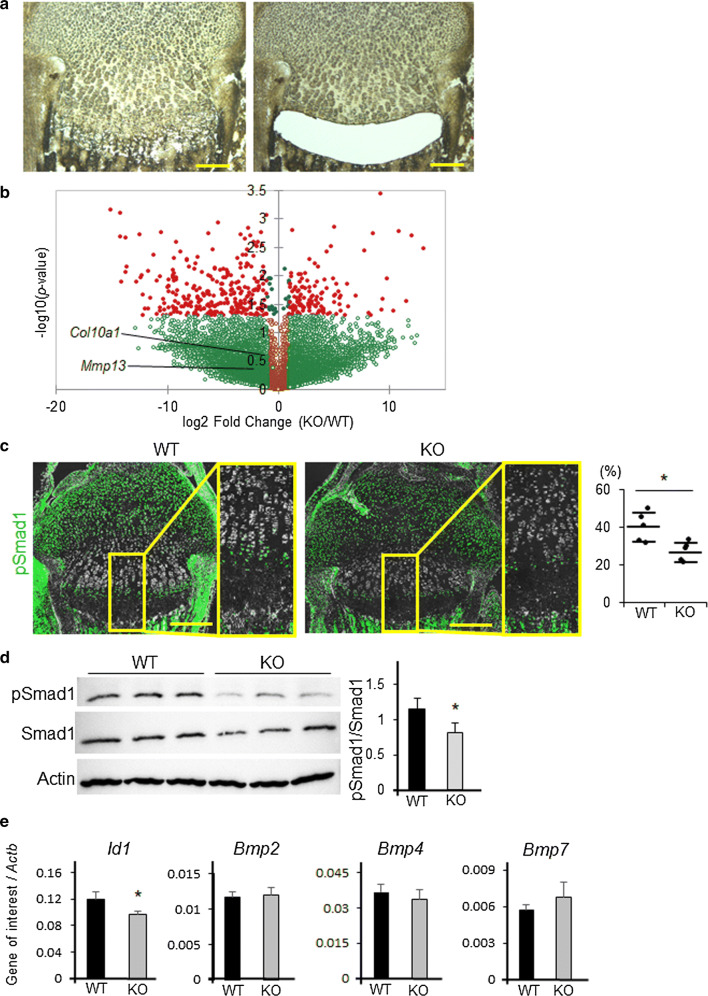
Fig. 5.
BMP signaling is reduced in the growth plates of Adamts17-/- mice. a Sections of proximal tibial epiphyseal cartilages before and after prehypertrophic and hypertrophic zones were microdissected by LMD. Extracted mRNA was amplified and analyzed by RNA sequencing. Scale bars, 200 µm. b Volcano plot for RNA-seq data obtained from laser microdissected samples. Red dots indicate genes that were significantly (p < 0.05) and differentially expressed in Adamts17 KO growth plates by more than twice or less than half those of WT growth plates. c Immunofluorescent staining of phosphorylated Smad1 (pSmad1) (green) and phase contrast images in proximal tibiae of WT and Adamts17-/- (KO) mice at P7 and the percentage of pSmad1-positive cells in the prehypertrophic and hypertrophic zones of WT and KO (n = 5 per genotype) mice. The inset box in the left panels indicates the location of the enlarged image shown on the right panels. Scale bars, 300 µm. d Immunoblotting of pSmad1, Smad1, and actin in protein extracts from primary chondrocytes from WT and KO mice and the ratio of pSmad1/Smad1 signal intensity (n = 3 wells per genotype). e Id1,Bmp2, Bmp4, and BMP7 mRNA levels in primary chondrocytes from WT and KO mice (n = 3 wells per genotype). mRNA levels were normalized to β-actin mRNA levels (Actb). Statistical significance was calculated using a two-tailed unpaired Student’s t test. *P < 0.05 versus WT

