Fig. 3.
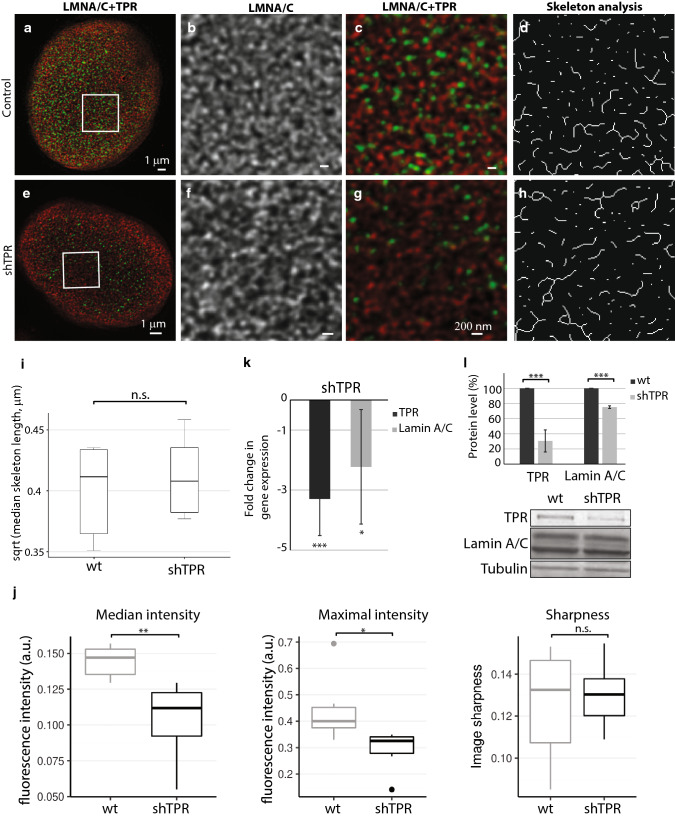
Lamin A/C network is not affected by long-term (3 weeks) reduced TPR amount by stable expression of shTPR. The lamin A/C network in control HeLa cell nucleus (a–d) and in a cell nucleus with reduced TPR amount (e–h) as visualized by STED. Cells were immunolabeled with mouse anti-lamin A/C (in red) and rabbit anti-TPR (in green). a, e Peripheral z-sections show the overview of lamin A/C organization. Insets in a and e correspond to b–d and f–h, respectively. Lamin A/C forms dense network of randomly organized filaments (b) that does not change in response to reduced TPR amount (f). c, g Merged image of lamin A/C (in red) and TPR (in green). d, h The graphical visualisation of skeleton analysis of the insets b and f, respectively. i Box plot shows square root transformed median lengths of skeletonized lamin A/C filaments in wild-type (wt) HeLa cells and in shTPR. Wt × shTPR: Student t test: T = − 0.61, df = 9.91, P = 0.6. j Comparison of descriptive statistics of median and maximal intensity and sharpness of the images. Intensity in sharpness was scaled to fit the range of 0–1. TPR depletion decreased both median (Wilcoxon exact test, W = 35.5, P = 0.004) and maximal (W = 33, P = 0.015) fluorescent intensity. k Fold change in mRNA levels of lamin A/C in shTPR cell line. TPR fold change: T = 7.2, df = 6, P < 0.001; LMNA/C fold change: T = 3.1, df = 6, P < 0.05. l Quantification of lamin A/C protein amount after TPR knock-down. TPR protein levels: T = 20.6, df = 8, P < 0.001; LMNA/C protein levels: T = 8.3, df = 8, P < 0.001. Graph represents data from three independent biological replicates analyzed in triplicates. Lower panel shows representative western blots stained with anti-TPR, anti-lamin A/C and anti-tubulin antibodies in control and in shTPR cells. ***P < 0.001, **P < 0.01, *P < 0.05, n.s. non-significant. 15 μg of total protein per each lane was loaded

