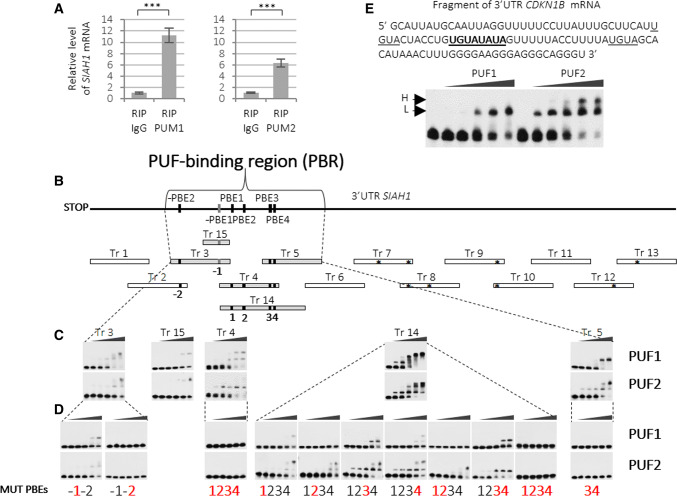
Fig. 2.
Identification of PUF1 and PUF2-binding region in SIAH1 3′UTR. a Results of real-time RT-qPCR showing enrichment of endogenous SIAH1 mRNA in anti-PUM1 or anti-PUM2 immunoprecipitates in HEK293FT cells. β-ACTIN and GAPDH mRNAs were used for normalization and represent 0 level. Nonimmune serum (IgG) was used as a negative control (RIP RNA immunoprecipitation). Error bars denote standard deviation (n = 9, P < 0.005). Western blot for RIP reaction is shown in Fig. S5. b Scheme of strategy used for the identification of specific PUF1 and PUF2-binding regions in SIAH1 3′UTR. Transcripts (Tr) identified as specifically binding PUF1 and PUF2 domains are shown in grey bars. EMSA-tested transcripts are marked at the top with asterisks denoting the presence of UGUA tetranucleotide (considered to be the core of the PBE motif). Motifs of PUM-binding elements −PBE2 and PBE2–4 on the diagram of SIAH1 3′UTR are shown in black squares, whereas, −PBE1, the only one identical to the PBE UGUANAUA consensus, is shown in dark grey. All PBEs are numbered (− 1 to 4) below each specifically binding fragment. c EMSA results of PUF1 and PUF2 domains specifically binding SIAH1 3′UTR fragments (PUF1—upper panels; PUF2—lower panels). The first lane in each EMSA result contains the transcript only and is followed by lanes containing increasing concentrations of PUF1 or PUF2-domains d EMSA analysis of transcripts with mutated PBE-like motifs (upper panels—PUF1 added; lower panels—PUF2 added). Mutated PBE motifs numbered in red bold. e EMSA analysis showing PUF1 and PUF2 domains binding the CDKN1B 3′UTR. The same protein concentration was used for both domains. Sequence of CDKN1B 3′UTR transcript used for EMSA with both PUF1 and PUF2 domains is presented at the top. PBE motif is in bold and underlined, and two core consensus sequences UGUA are underlined. Lower (L) and higher (H) complexes formed are indicated. The first lane of each EMSA panel indicates naked transcript, whereas the other lanes denote increasing concentrations of PUF1 or PUF2 domains added to the binding reaction (20, 50, 100, 300, and 500 nM)

