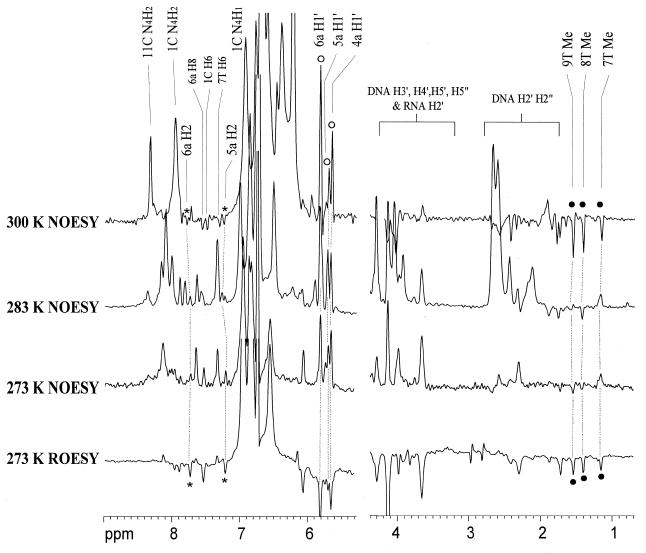
Figure 3.
Cross-sections through the water chemical shift along the F1 dimension of [d(CGC)r(aaa)d(TTTGCG)]2 at 273, 283 and 300 K with mixing time of 100 and 50 ms respectively for NOESY and ROESY spectra. The hydration peaks of adenine H2 and H1′ protons are labeled with asterisks and open circles respectively. The hydration peaks of thymine methyl protons are labeled with filled circles.

