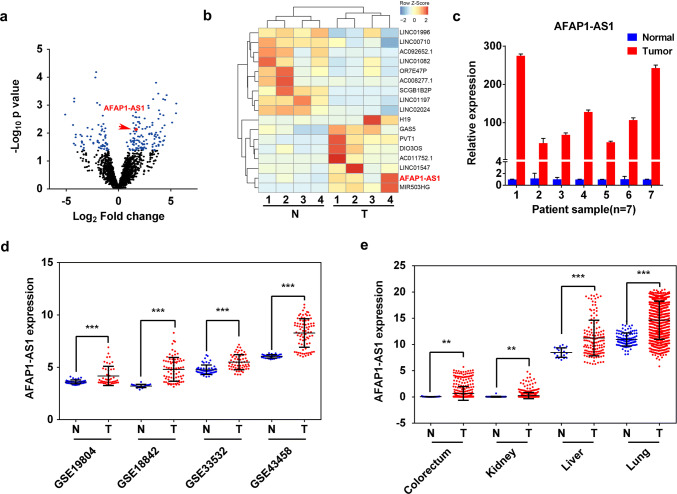
Fig. 1.
Upregulation of lncRNA AFAP1-AS1 expression in NSCLC tumors. a Volcano plot and b hierarchical cluster plot displaying differentially expressed lncRNAs between NSCLC tumors and adjacent normal tissues. The X-axis represents log2 fold changes and the Y-axis represents log10p values. The blue dots denote the lncRNAs with the significantly differential expression (p < 0.05 and abs (log2 [FC]) > 0.75). AFAP1-AS1, highly expressed in NSCLC tumors, is presented as red dot. c qRT-PCR analysis of AFAP1-AS1 expression in 7 NSCLC tumors and their paired adjacent non-tumor tissues. Comparison of AFAP1-AS1 expression in tumors to normal tissues with the data obtained from GEO database for NSCLC (d) and from TCGA database for colorectum, kidney, liver and lung cancer tumors (e). Data are represented as mean values ± SD. *p < 0.05; **p < 0.01; ***p < 0.001 (two-tailed Student’s t test)

