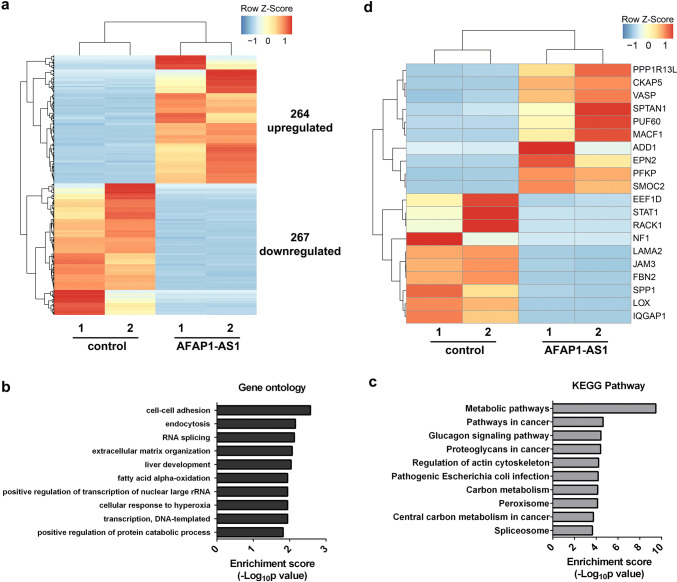
Fig. 4.
Effect of AFAP1-AS1 on gene expression in H1299 cells. a Hierarchical cluster plot of the differentially expressed genes in H1299-AFAP1-AS1 cells compared to H1299-control cells. b GO analyses listing the top ten biological processes regulated by AFAP1-AS1. c KEGG pathway analyses showing the top ten pathways affected by AFAP1-AS1. d Hierarchical cluster plot of the differentially expressed and metastasis-associated genes between H1299-control or H1299-AFAP1-AS1 cells, using a cutoff of fold change > 2 and adjusted p value < 0.05

