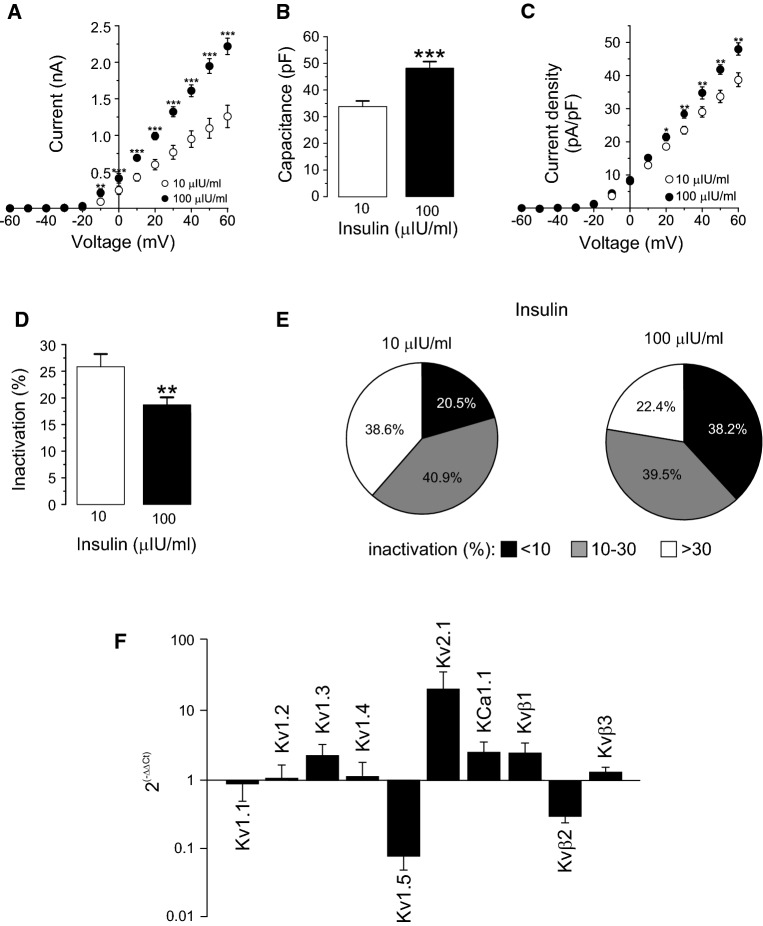
Fig. 3.
High insulin concentrations remodeled Kv currents in adipocytes. SVF-derived adipocytes were incubated 4–7 days in low (10 µIU/ml) or high (100 µIU/ml) insulin concentrations following what described in the methods section. From a holding potential of − 60 mV, Kv currents were elicited by applying 250 ms pulses from − 60 to + 60 mV in 10 mV steps. a Current–voltage relationship in both conditions. b Cell capacitance in pF. c Current density (pA/pF) vs voltage (mV) plot of K+ currents in both conditions. d Percentage of inactivation at + 60 mV. Data are the mean ± SE of 44 (10 µIU/ml) and 76 (100 µIU/ml) cells. Circles and columns: white, 10 µIU/ml; black, 100 µIU/ml insulin. Statistical significance is denoted as *p < 0.05, **p < 0.01 and ***p < 0.001 vs 10 µIU/ml Student’s t test. e Distribution of cells according to their inactivation percentage at + 60 mV: poor (< 10%), intermediate (10–30%) or pronounced (> 30%) inactivation, at each insulin concentration. A high insulin concentration triggers a notable switch in the Kv phenotype. Black, < 10%; gray; 10–30%; white, > 30%. f RT-PCR was performed from mRNA purified from isolated epididymal adipocytes as described in methods and the relative expression was calculated by applying 2(−∆∆Ct). 18s ribosomal RNA was used as a loading control and 10 µIU/ml data was taken as reference (value of 1). Adipocytes were incubated in the presence of 10 and 100 µIU/ml for 3 days. Data are the mean ± SE of three independent rats each performed in triplicate

