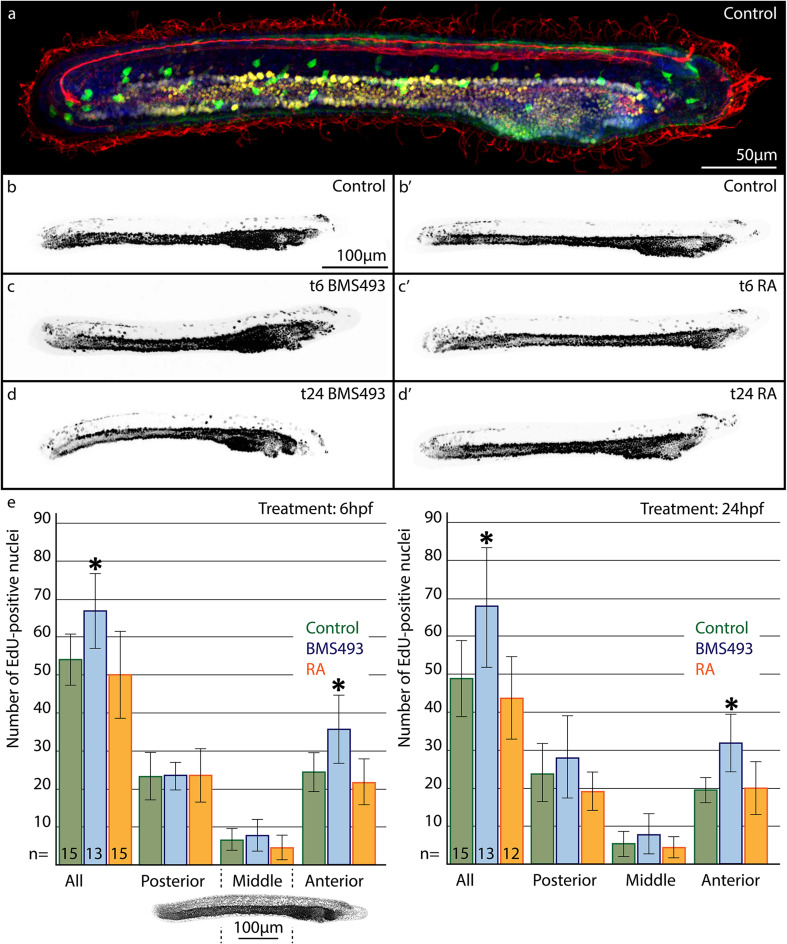
Fig. 5.
Effects of retinoic acid (RA) signaling alterations on cell proliferation in the ectoderm of amphioxus larvae. a–d′ Animals at 36 hpf (hours post fertilization) are shown in lateral view with their anterior ends directed towards the right. a Larva that was stained for 5-ethynyl-2′-deoxyuridine (EdU, yellow), for glutamate-immunoreactivity (GLU-ir, green), for acetylated tubulin-ir (AT-ir, red), and with the nucleic acid dye Hoechst (blue). b–d′ Images showing only the color-inverted fluorescent signal for EdU (grey). a–b′ Control animals treated with DMSO. c, d Animals treated with the RA receptor (RAR) antagonist BMS493. c′, d′ Animals treated with all-trans RA. The treatment time points (t), at either 6 or 24 hpf, are given in the upper right corner of each image. e Statistical analyses of the observed effects of RA signaling alterations on ectodermal cell proliferation. Colored bars depict the average number of EdU-positive nuclei present in the whole ectoderm (all) or in specific ectodermal sections along the anterior–posterior axis. The image below the first diagram shows Hoechst labeling (grey) in a larva at 36 hpf, with dotted lines marking the sections of the ectoderm (posterior, middle, anterior), in which EdU-positive nuclei were counted. Green, blue, and red bars stand, respectively, for control animals, for animals treated with BMS493, and for animals treated with all-trans RA. For each diagram, treatment time points (t), at either 6 or 24 hpf, are given in the upper right corner, and the number (n) of animals that were counted per condition is indicated at the base of the first three colored bars. Error bars depict the standard deviation (σ). Asterisks (*) above error bars indicate that the difference between this condition and the corresponding control is statistically significant. The scale bar in b also applies to c, d, b′–d′

