Fig. 1.
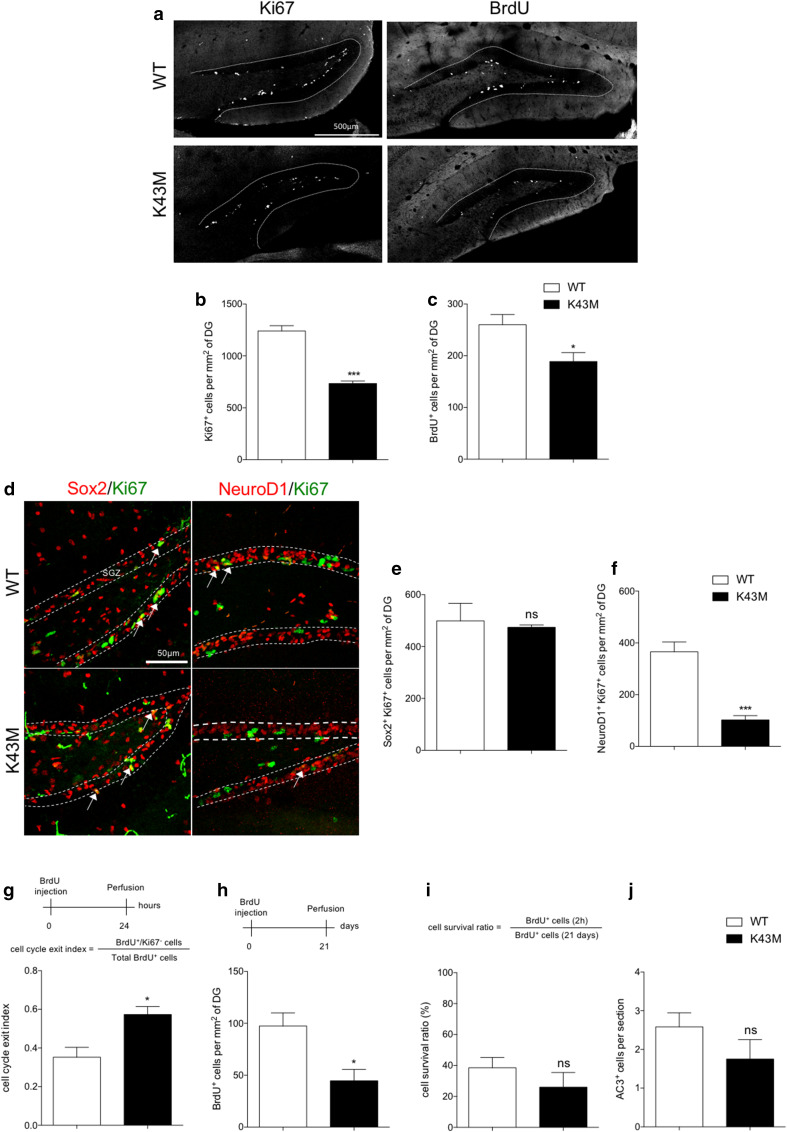
Cdk6 kinase activity regulates hippocampal neurogenesis. a Representative single-plane confocal images of Ki67 and BrdU staining in the DG of WT and K43M mice. Histograms showing the number of Ki67+ (b) and BrdU+ (c) cells per mm2 of DG in WT and K43M mice. d Representative single-plane confocal images of Sox2/Ki67 and NeuroD1/Ki67 double staining in the DG of WT and K43M mice. White arrows in d point to double-labeled cells. The dotted lines indicate the location of the SGZ. Histograms showing the number of Sox2+Ki67+ (e) and NeuroD1+Ki67+ (f) cells per mm2 of DG in WT and K43M mice. Schematic representation of the experimental design used to determine cell cycle exit (g), neurogenesis (h) and cell survival (i), accompanied by histograms showing the cell cycle exit index (g), the number of BrdU+ cells per mm2 (h), the cell survival ratio (i) and the number of AC3+ cells per section in the DG of WT and K43M mice (j). Data are presented as mean ± SEM and were analyzed by an unpaired two-tailed Student’s t test. N = 4 mice per genotype in b, c, e, f, h and i. N = 3 mice per genotype in j. N = 3 and 4 mice for WT and K43M, respectively in g. *p < 0.05; ***p < 0.001. SGZ subgranular zone, ns not significant

