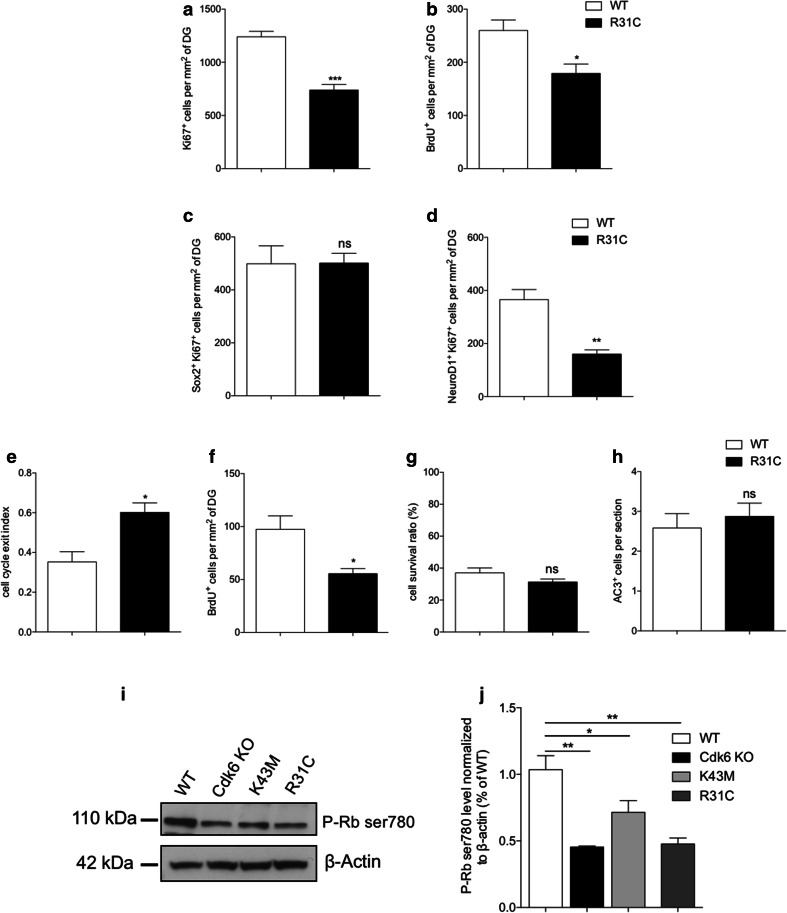
Fig. 2.
Cdk6R31C mutation reduces hippocampal neurogenesis. Histograms showing, respectively, the number of Ki67+ (a), BrdU+ (b), Sox2+Ki67+ (c) and NeuroD1+Ki67+(d) cells per mm2 of DG in WT and R31C mice. Histograms showing, respectively, the cell cycle exit index (e), the number of BrdU+ cells per mm2 (f), the cell survival ratio (g) and the number of AC3+ cells per section in the DG of WT and R31C mice (h). i Representative western blot analysis of phospho-Rb Ser780 level in protein extracts from 4- to 6-week-old WT, Cdk6 KO, K43M and R31C mice. β-actin serves as a loading control. Histogram showing the quantification of the western blots illustrated in j. Data are presented as mean ± SEM and were analyzed by an unpaired two-tailed Student’s t test (a–h) or one-way ANOVA followed by a Newman–Keuls post hoc test (j). N = 4 mice per genotype in a–c, f and g. N = 3 mice per genotype in e, h and j. N = 4 and 3 mice for WT and R31C, respectively, in d. *p < 0.05; **p < 0.01; ***p < 0.001. ns not significant

