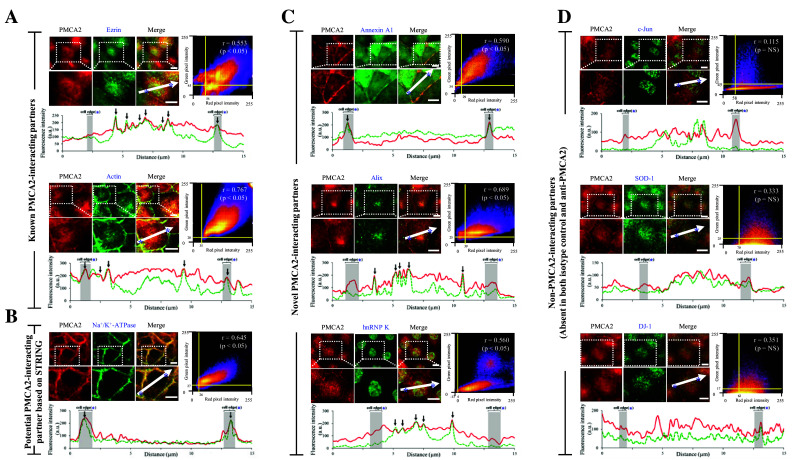
Fig. 4.

Quantitative immuno-co-localization analysis of PMCA2 and its interacting partners. a PMCA2 vs. known PMCA2-interacting partners (ezrin and actin) (served as the positive controls). b PMCA2 vs. potential PMCA2-interacting partners based on STRING analysis (Na+/K+-ATPase). c PMCA2 vs. novel PMCA2-interacting partners (annexin A1, Alix and hnRNP K). d PMCA2 vs. non-PMCA2-interacting partners (c-Jun, SOD-1 and DJ-1) (served as the negative controls). In each pair, intensity correlation scatter plot estimated the degree of co-localization between red (PMCA2) and green (protein partner of interest) signals. Pixel intensity thresholds are indicated with yellow lines. Pearson’s correlation coefficient (r) of the co-localization is shown in the top-right corner of the plot. Intensity profile of the two immunofluorescence signals along the linear section of area of interest (indicated with white arrow) at a distance of 15 µm across the cell is depicted at the bottom of each pair. PMCA2 is displayed as a red line, whereas the partner protein of interest is displayed in green-dotted line. Area of the cell edge (plasma membrane) is labeled with an asterisk and highlighted in gray. Co-localization of the two probes is indicated with black arrow. A scale bar represents 5-μm-distance
