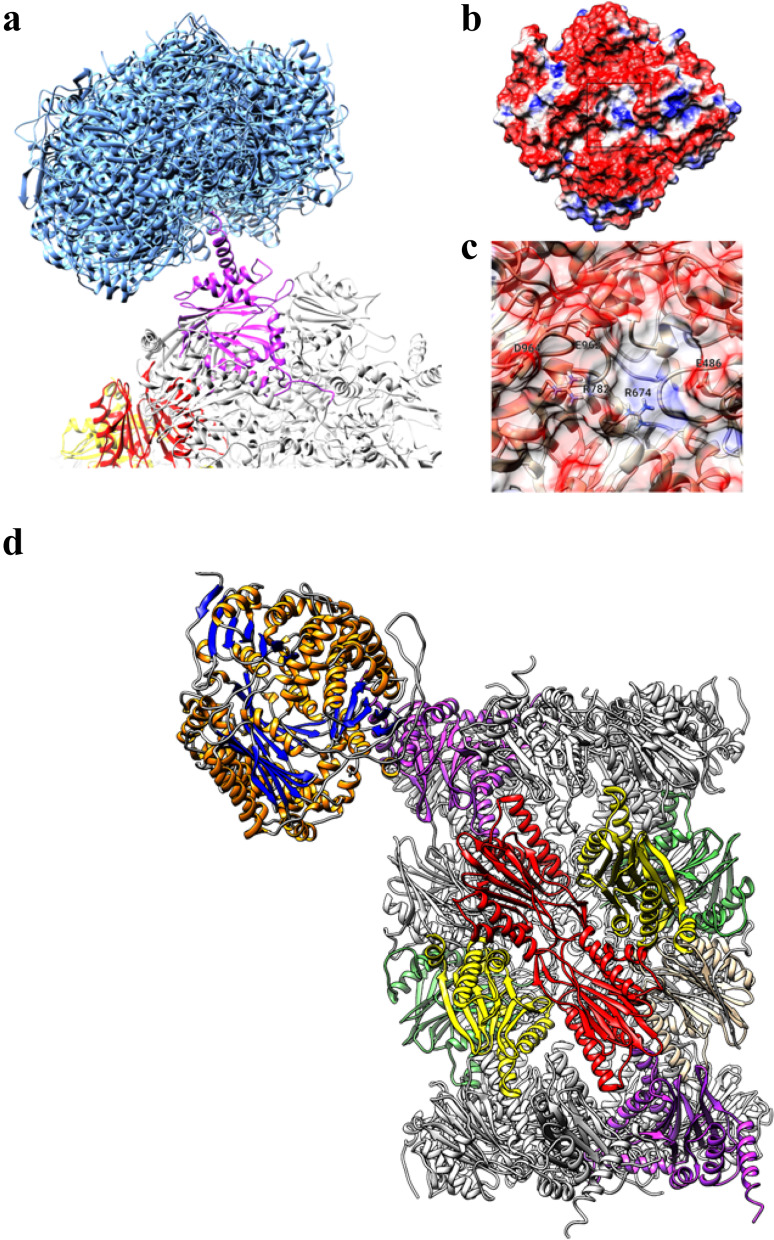
Fig. 6.
a Top-10 best-scoring poses obtained by docking of IDE on h20S (IDE poses are represented as blue ribbons, proteasome α-3 subunit is shown in magenta). b Molecular surface of IDE colored using electrostatic potential (red: < − 1 eV/kT, blue: > + 1.0 eV/kT). c Close-up of the preferred binding site of IDE (residues showing direct hydrogen bond or salt bridges interaction with the proteasome α-3 subunit are labeled). d Overview of the best-scoring IDE–h20S complex. IDE is indicated by ribbon with orange helices and blue beta-sheets. 20S α-3 subunits are shown in magenta, β-2 subunits (trypsin-like activity) in red, β-5 (chymotrypsin-like activity) in yellow and β-1 (caspase-like activity) in green

