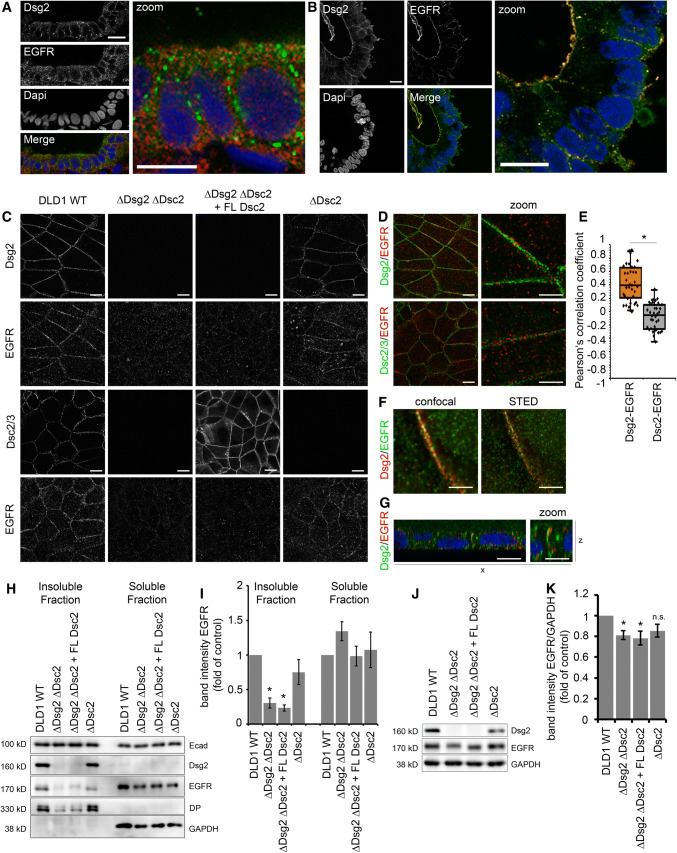
Fig. 1.
Dsg2 knockout results in mislocalization and reduced protein levels of EGFR in intestinal epithelial cells. a Immunostaining for Dsg2 (green) and EGFR (red) in patient tissue sections of the colon revealed co-localization of both proteins. Four independent patient tissue samples were analyzed. Shown is representative image of a section from the colon. Bar 10 µm. b Immunostaining for Dsg2 (green) and EGFR (red) in human enteroids revealed co-localization of both proteins along the cell borders as well as on the surface facing the lumen. Shown is representative image for ten enteroids. Bar 10 µm. c Confluent cell monolayer of DLD1 cells grown on coverslips were immunostained for EGFR, Dsg2, and Dsc2/3. Loss of Dsg2 but not Dsc2/3 results in a major loss of EGFR staining at cell borders. Bar 10 µm. d Merged images of immunofluorescence staining of Dsg2, EGFR, and Dsc2/3 show co-localization of Dsg2 and EGFR but not Dsc2/3 and EGFR. Bar 10 µm (left panel) and 5 µm (right panel). e Evaluation of the Pearson correlation coefficient of EGFR confirms a co-localization of EGFR with Dsg2 but not Dsc2. Shown are boxplots with each point representing one analyzed area along the cell border. *p < 0.05. f STED super resolution microscopy analysis of Dsg2 and EGFR co-immunostaining shows co-localization. Bar 5 µm. g x–z image of Dsg2 and EGFR co-immunostaining shows specific co-localization at the apical site of cell contacts. Bar 10 µm (left panel) and 5 µm (right panel). h EGFR is absent in the Triton X-100 insoluble fraction when Dsg2 is missing in contrast to Ecad that is not affected by Dsg2 knockout. GAPDH served as loading control. i Band intensity of detected EGFR was measured from five independent experiments, showing a significant reduction of EGFR in the insoluble fraction in Dsg2-deficient DLD1 cells. Results are shown as mean ± SE. *p < 0.05. j Total protein level of EGFR in DLD1 cells were assessed by western blotting that revealed reduced EGFR levels in Dsg2-deficient cells. GAPDH served as loading control. k Band intensity of detected EGFR was quantified from at least ten independent experiments, demonstrating a significant reduction of total EGFR protein levels upon Dsg2 knockout. Shown are mean ± SE. *p < 0.05

