Fig. 1.
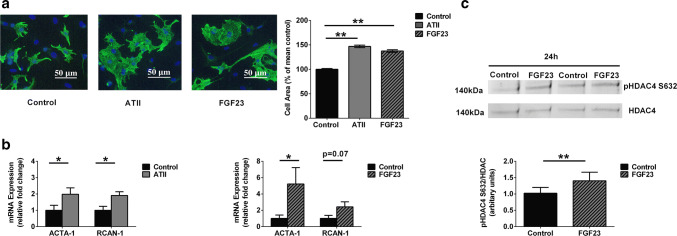
Hypertrophic response to ATII and FGF23 treatments. a Representative images of isolated NRVMs after 48-h treatment ATII and FGF23, as revealed by immunocytochemical analysis using antibodies to cardiomyocyte-specific Desmin (green) and DAPI (blue) used to identify nuclei (scale bar: 50 μm). The bar graphs shows relative percentage change in cell area which was analyzed compared with that of vehicle-treated control cells (black) for 48 h of treatment of NRVMs with ATII (grey) and FGF23 (pattern) (mean ± SEM; N = 5 independent isolations; n> 1000 cells per group; **P < 0.01, compared with control cells; Kruskal–Wallis followed by Dunn’s test). b Compared to control cells (black), expression of genes ACTA-1 and RCAN-1 at 1 h of ATII treatment (left) (grey). Compared to control cells (black), expression of genes ACTA-1 and RCAN-1 at 6 h of FGF23 treatment (right) (pattern) (mean ± SEM; N = 5 independent isolations quantified by RT-PCR normalized to GAPDH gene expression; *P < 0.05, compared with corresponding control; unpaired t test or Mann–Whitney U test). c Degree of phosphorylation of HDAC4 at Serine 632 site was examined by immunoblot (above) in NRVMs treated with FGF23 vs. control at 24 h time-point. The bar graph (below) is from N = 6 independent isolations (mean ± SEM; **P < 0.01, compared with vehicle-treated control cells; paired t test)

