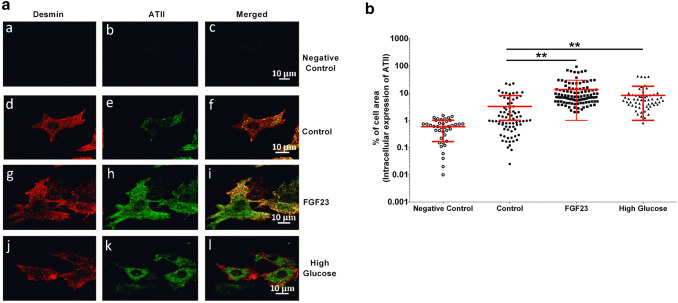
Fig. 5.
Expression of intra-cardiac ATII induced by FGF23 treatment for 90 min. a Representative confocal images of NRVM immunofluorescence in negative control (a–c), vehicle-treated control (d–f), FGF23 (g–i), and high glucose (25 mM) (j–l) conditions after 90 min of treatment (scale bar: 10 μm). b Quantitative analysis by thresholding (see “Methods” for details) of ATII-specific cellular immunofluorescence for all the treatments at 90 min (each symbol represents 1 cell; mean ± SD; ncells ≥ 40 for each group; N ≥ 3 isolations of NRVMs; **P < 0.01, compared with corresponding vehicle-treated control cells; Kruskal–Wallis followed by Dunn’s test)

