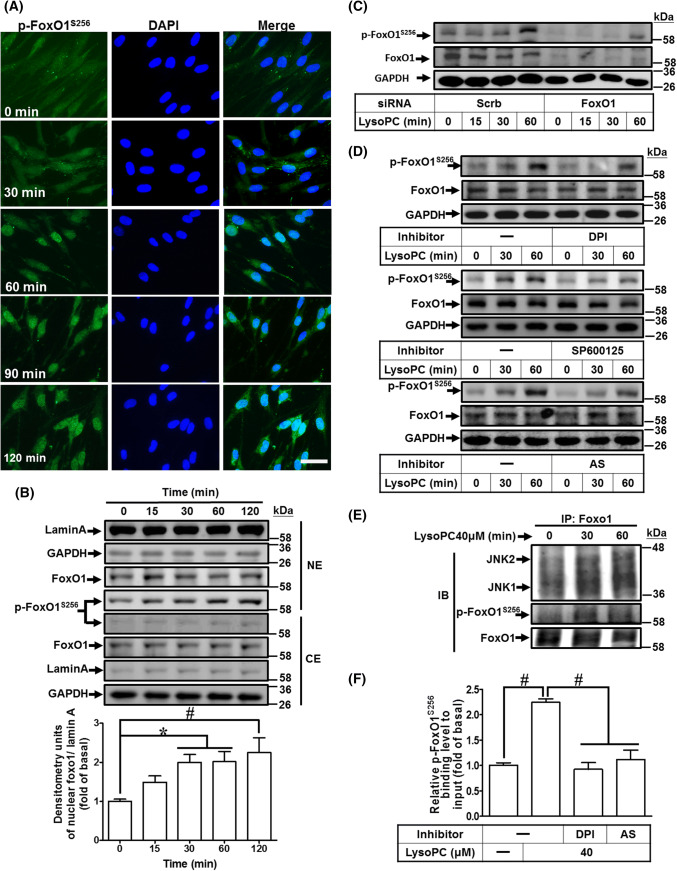
Fig. 5.
LysoPC-mediated phosphorylation at Ser256 of FoxO1 increases nuclear localization and DNA binding activity on COX-2 promoter. a, b HCFs were incubated with LysoPC (40 μM) for the indicated time points. a Immunofluorescence staining was performed with an anti-phospho-FoxO1S256 antibody, labeled with FITC (green) and DAPI (blue), and observed by using a fluorescence microscope (scale bar, 100 μm). b The cytosolic and nuclear fractions were prepared and subjected to western blot analysis. Lamin A and GAPDH were used as a marker protein for the nuclear and cytosolic fractions, respectively. Quantification data of nuclear phospho-FoxO1S256 data is presented in the bottom panel (n = 6). c HCFs were transfected with siRNA of scramble or FoxO1 and then treated with LysoPC for the indicated time intervals. The levels of FoxO1, phospho-FoxO1S256, and GAPDH protein were determined by western blot (n = 7). The densitometry measurements of phospho-FoxO1S256 are presented in Supplementary Fig. 5A. d HCFs were pretreated with DPI (100 nM; n = 7), SP600125 (1 μM; n = 5), or AS1842856 (AS, 100 nM; n = 7) for 1 h, and then treated with LysoPC for the indicated time intervals. The levels of phospho-FoxO1S256, FoxO1, and GAPDH protein were determined by western blot. The densitometry measurements of phospho-FoxO1S256 are presented in Supplementary Fig. 5B–D. e HCFs were treated with LysoPC for the indicated time intervals and subjected to immunoprecipitation assay using an anti-FoxO1 antibody. The immunoprecipitates were analyzed by western blot using an anti-JNK1/2, anti-phospho-FoxO1S256, or anti-FoxO1 (as an internal control) antibody. Data are representative of three independent experiments (n = 3). f HCFs were pretreated with DPI (100 nM) or AS1842856 (100 nM) for 1 h and then incubated with LysoPC for 1 h. The DNA binding activity of phospho-FoxO1S256 was determined by a ChIP assay. Quantification of data was performed by an SYBR system for qPCR, and the results are shown as the fold change normalized to input control (n = 5). Data are presented as mean ± SEM, and analyzed by one-way ANOVA with Tukey’s post hoc tests. *p < 0.05; #p < 0.01. NE nuclear extract, CE cytosolic extract

