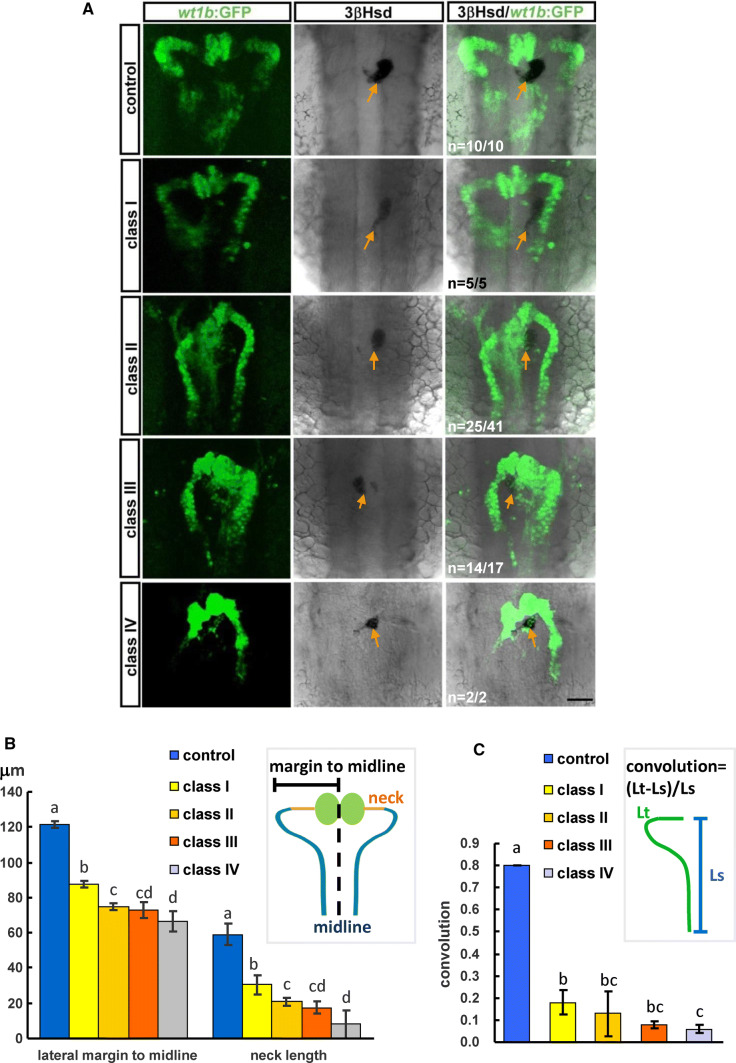
Fig. 3.
The phenotype of kidney and interrenal tissue in the lrp4-sd morphant. a The kidney morphology was delineated by the wt1b:GFP, and the steroidogenic interrenal cells were detected by 3β-Hsd activity staining (orange arrows). b The pronephric structure was quantified by measuring the average distance from bilateral margins to the midline, and the average length of bilateral pronephric necks. c The pronephric convolution was arbitrarily defined as the ratio of the length of the proximal pronephric tubules marked by the wt1b:GFP (Lt) minus the length of a straight line connecting the ends of this segment (Ls) divided by the length of this straight line. Histograms with different letters above them are significantly different (ANOVA and Duncan’s multiple test, P<0.05)

