Fig. 3.
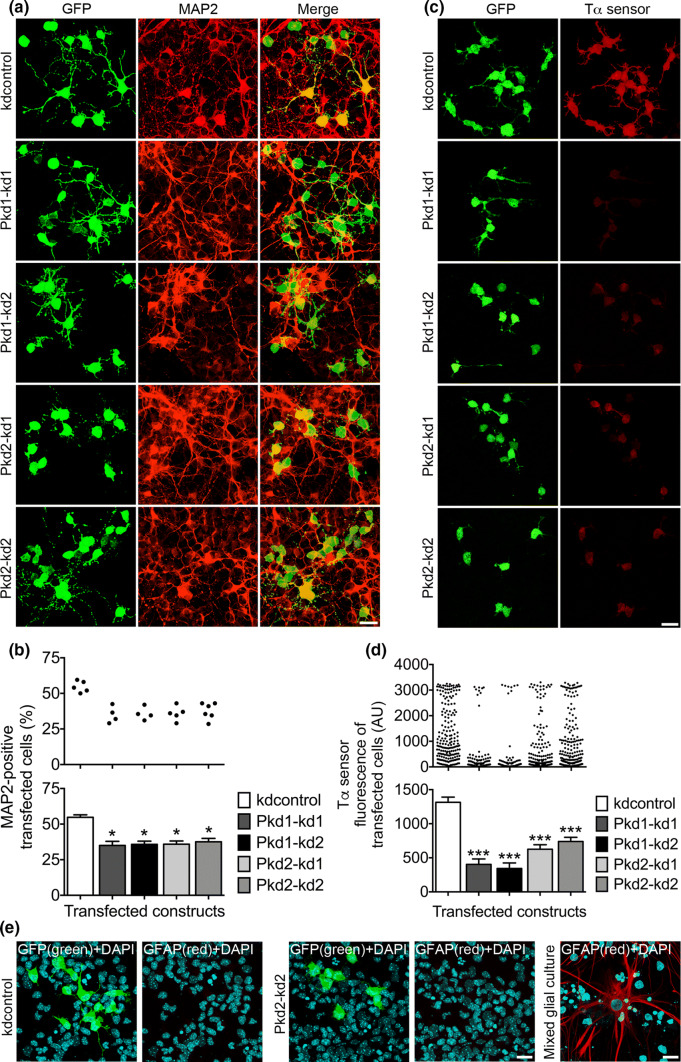
The expression of PC1 and PC2 is vital for the neurogenic differentiation of NPCs. a Primary mouse E13.5 neocortical cells were cultured in the presence of 20 ng/ml bFGF, transfected on DIV1 with the indicated constructs, and analyzed 3 days later following fixation. Double staining immunocytochemistry was performed to label GFP-positive transfected cells (green) and MAP2-positive differentiating cells (red). Overlay pictures are presented to illustrate the MAP2-positive transfected cells (merge). Scale bar, 15 μm. b The percentage of MAP2-positive transfected cells was ascertained. The percentage of MAP2-positive transfected cells was reduced by knockdown of either PC1 (to ~ 64% for both Pkd1 knockdown constructs) or PC2 (to ~ 65% for Pkd2–kd1 and ~ 69% for Pkd2–kd2), when compared to the control (kdcontrol). Data are given in a histogram as mean ± SEM (*p < 0.05; Dunn’s multiple comparison post hoc test following Kruskal–Wallis) and in a scatter plot (one dot represents the percentage of MAP2-positive transfected cells of a group of 600 analyzed transfected cells). c Primary neocortical cells were prepared and cultured as described above. However, on DIV1 the cells were co-transfected with the indicated shRNA constructs and the Tα1p-DsRed2 construct to report the expression from the Tα1p. The cells were fixed on DIV4. The transfected cells were co-immunostained for GFP (green) and DsRed (Tα sensor; red) to quantify the activity of the Tα1p. Scale bar, 15 μm. d Knockdown of either PC1 (to ~ 31% for Pkd1–kd1 and ~ 26% for Pkd1–kd2) or PC2 (to ~ 48% for Pkd2–kd1 and ~ 56% for Pkd2–kd2) led to a strong decrease of the expression from the Tα1p, when compared to the control (kdcontrol). Data are presented in a histogram as mean ± SEM (***p < 0.005; Dunn’s multiple comparison post hoc test following Kruskal–Wallis) and in a scatter plot (one dot represents the red fluorescence intensity of one analyzed cell). e Primary neocortical cells were prepared and cultured as described in a. The cells were co-stained for DAPI (to label all cell nuclei) and GFP (the transfected shRNA constructs drive GFP expression), or DAPI and glial fibrillary acidic protein (GFAP; to label astrocytes). No astrocytes could be detected in our NPC culture. A mixed glial culture prepared from E19 cortices served as positive control for the GFAP staining of astrocytes. Scale bars, 10 μm

