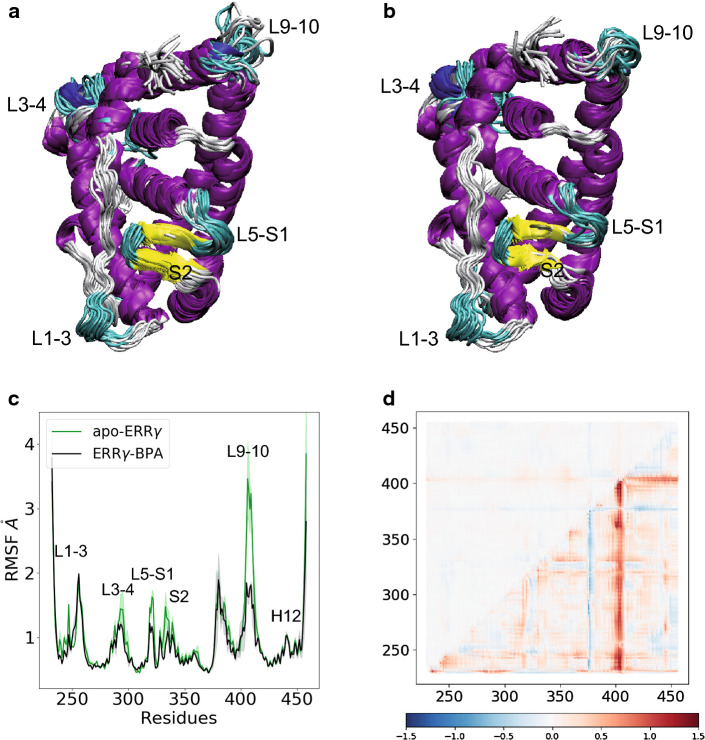
Fig. 4.
Molecular dynamics analysis of BPA-bound ERRγ LBD. Representative simulated ensembles of the ERRγ LBD in a its apo form, and in b complex with BPA. c The RMSF of the backbone atom positions measured for the apo- (green) and BPA-bound (black) ERRγ LBDs. Average (hard lines) and standard deviation (shades) over the three replica are represented. d Structural and dynamical effects of ligand binding expressed in terms of Cα–Cα distances. Ratio between the averages (upper half) and variances (lower half) of distance distributions in the unliganded and ligand-bound simulations is reported in a logarithmic scale. Red color corresponds to larger structural deviations (upper half) or fluctuations (lower half) in the apo-ERRγ compared to the BPA-bound ERRγ LBDs

