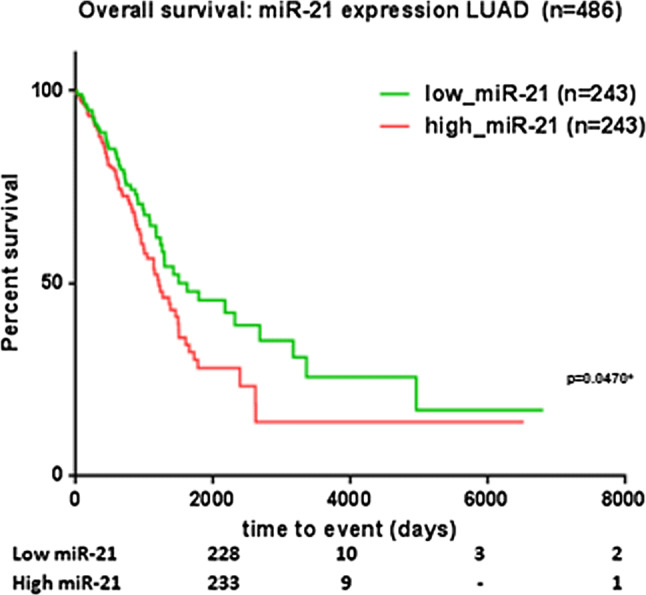
Fig. 4.

MiR-21 expression associated with cancer-specific mortality in lung adenocarcinoma patients. Kaplan–Meier curve on TCGA data from patients with LUAD (n = 486). Patients were separated in low- and high-expression based on the median value; TCGA The Cancer Genome Atlas, LUAD lung adenocarcinoma; *p < 0.05
