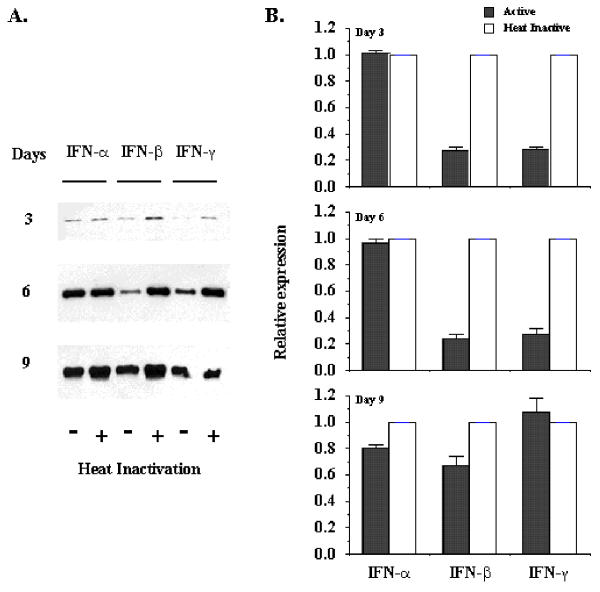
Figure 5.
Effect of interferons on SMA abundance in rat HSCs. Sub-cultured HSCs were incubated with 500 U/ml of IFN-α, IFN-β and IFN-γ for 3, 6, or 9 days. Panel A exhibits the typical Western blot of SMA expression. Panel B represents densitometric data of Western blot analysis. Active form of IFNs was compared with heat-inactivated (HI) form of IFNs, which were arbitrarily set at 1. The data represent mean ± SEM from four experiments.

