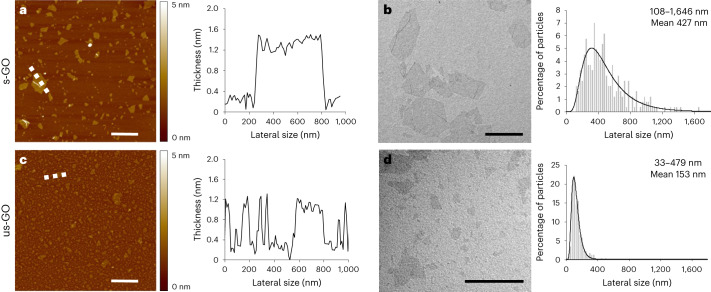
Fig. 1. GO nanosheet size distributions.
a–d, Morphological characterizations of s-GO (a,b) and us-GO (c,d). The images (left) and spectra (right) are representative of the technical replicates performed. Atomic force microscopy height images (left; a and c) with the corresponding cross-section analysis along the indicated dashed white lines (right; a and c). The colour bars indicate the height intensity range from 0 to 5 nm. Transmission electron microscopy micrographs (left; b and d) with the size distribution analyses using a Gaussian single peak fitting depicted with solid lines (right; b and d) are shown. Scale bars are 1 µm. The lateral size range and means given in b and d are an average of 242 and 224 individual GO sheets, respectively (see a summary table in Extended Data Table 1).

