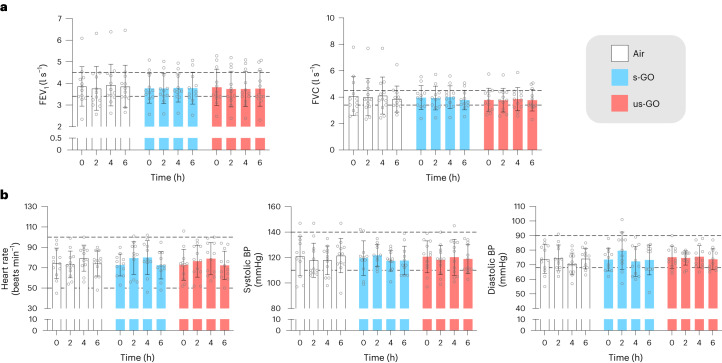
Fig. 3. Lung function and cardiovascular vital signs for exposure to air, s-GO and us-GO.
a, Lung function as determined by the forced expiratory volume in 1 s (FEV1, left) and forced vital capacity (FVC, right). b, Cardiovascular vital signs: heart rate (left), systolic BP (middle) and diastolic BP (right). The dotted lines represent the upper and lower limits of expected normal values and the coloured bars and error bars show the mean ± s.d. (n = 12 for air and us-GO groups, n = 11 for s-GO groups; biologically independent measurements). No significant differences were found between treatments (two-way analysis of variance followed by Tukey’s post hoc test).

