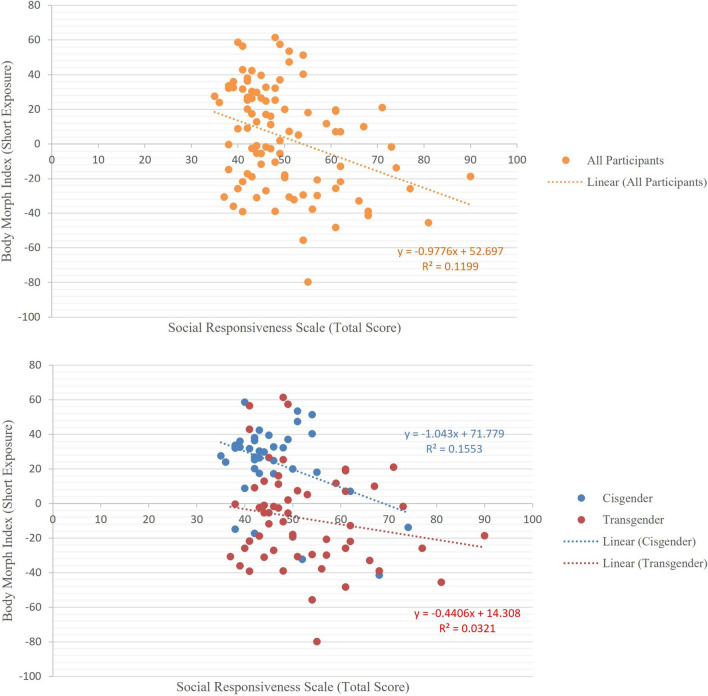
Fig. 2.
Correlation of Social Responsiveness Scale (total T scores) and Body Morph Index (short exposure) across all participants (n = 95, above), all transgender participants (n = 58) and all cisgender participants (n = 37) (below). A significant and negative correlation was found between the SRS total scores and Body Morph Index among all participants (r (95) = − .329, P = .001), indicating that those with higher autistic traits had greater body incongruence. The correlation was negative in both transgender and cisgender participants separately, but not statistically significant

