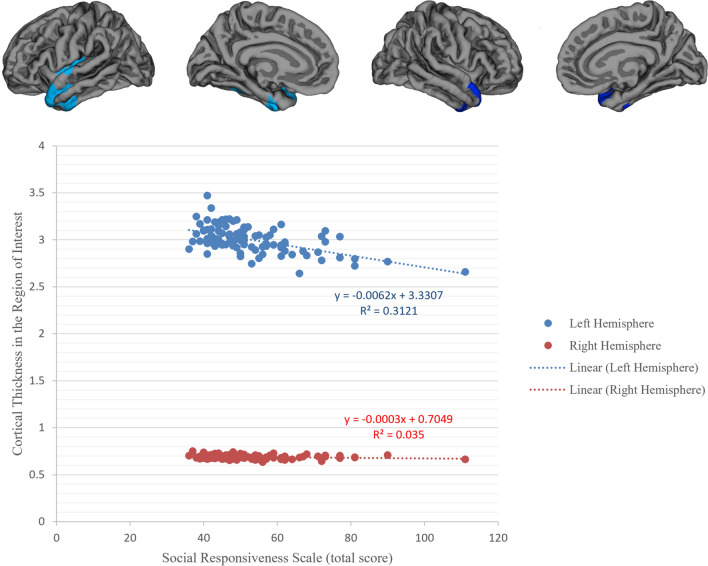
Fig. 3.
Clusters exhibiting statistically significant correlation with Social Responsiveness Scale (SRS) (total T scores) among transgender participants (above). Results were corrected for multiple comparisons using Cluster-based Monte Carlo simulations, p < .05. The mean cortical thickness at all cluster in left and right hemisphere was extracted, and their correlation against SRS total T scores is illustrated (below). The SRS total T scores were significantly and negatively correlated with cortical thickness in left superior temporal (size 47, X: − 42.7; Y: 10; Z: − 22.5) (r = − 0.5, p < 0.001) but only at trend level with the cluster in the right superior temporal (size 1082.33; X: 46.9; Y: 11.1; Z: − 18.9) (r = − 0.184, p = 0.069). When removing the outliers, the correlations became significant for both left (r = − 0.462, P < 0.001) and right (r = − 0.247, P = 0.018) hemispheres

