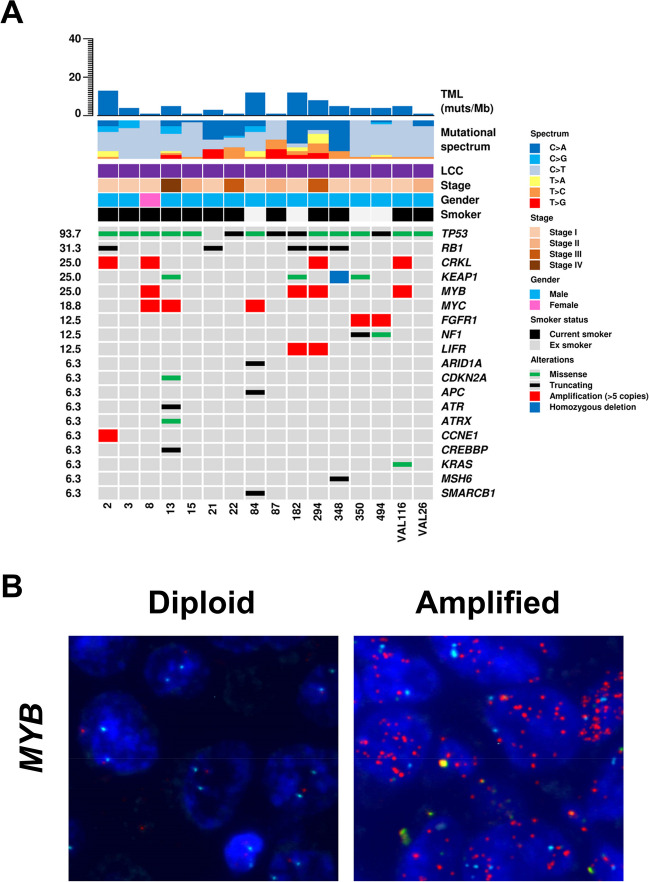
Fig. 1.
Genomic features of LCC and FISH validation for MYB gene amplification. A The upper histogram shows the tumour mutational load, defined as the number of mutations per megabase (muts/Mb), of each sample. The central matrix shows 19 genes that were found altered at sequencing analysis. Genes are listed according to the frequency of alterations. B Representative images of the FISH validation for MYB gene of a diploid (on the left) and an amplified case (on the right). Red spots mark MYB gene, while the spectrum green spots label the centromere of chromosome 6

