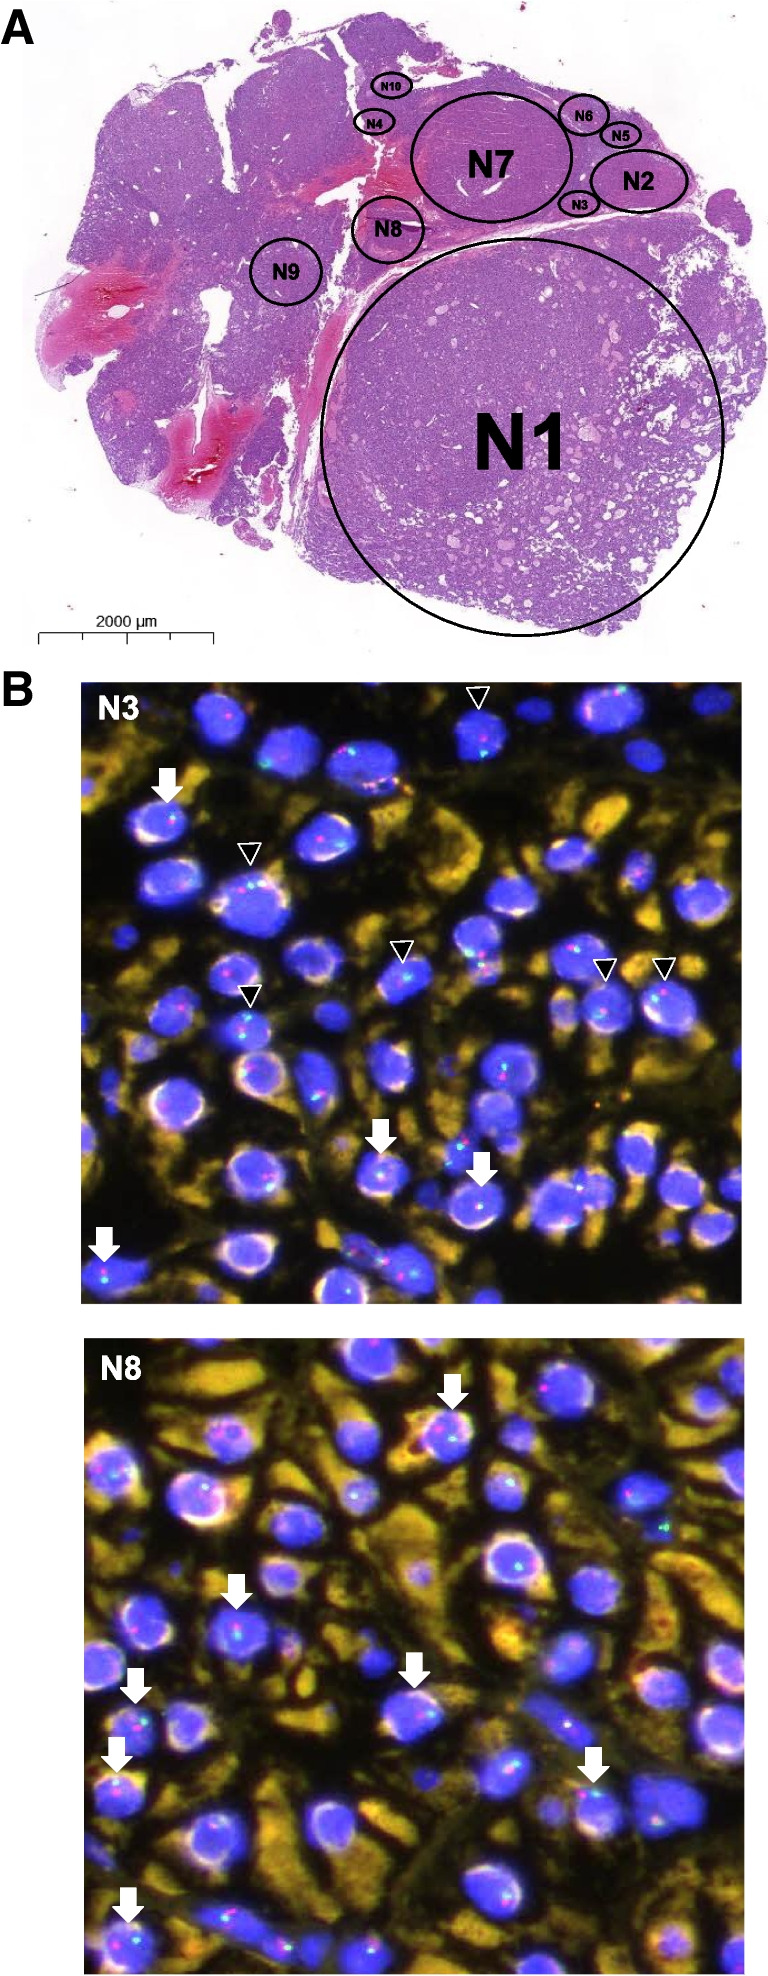
Fig. 1.

FISH analysis. A MEN1 parathyroid adenoma (H&E) consisting of ten distinct (micro)nodules (N) (extended version in Fig. S1). B FISH analysis of micronodules N3 and N8 reveals a heterogeneity of patterns; while N3 shows mostly MEN1 loss of heterozygosity (LOH), N8 shows centromere 11 loss in most cells. Arrowheads indicate MEN1 LOH. Arrows indicate centromere 11 loss. Red fluorophore indicates MEN1 11q13 locus and green fluorophore indicates CEN11p 11p11.12 locus
