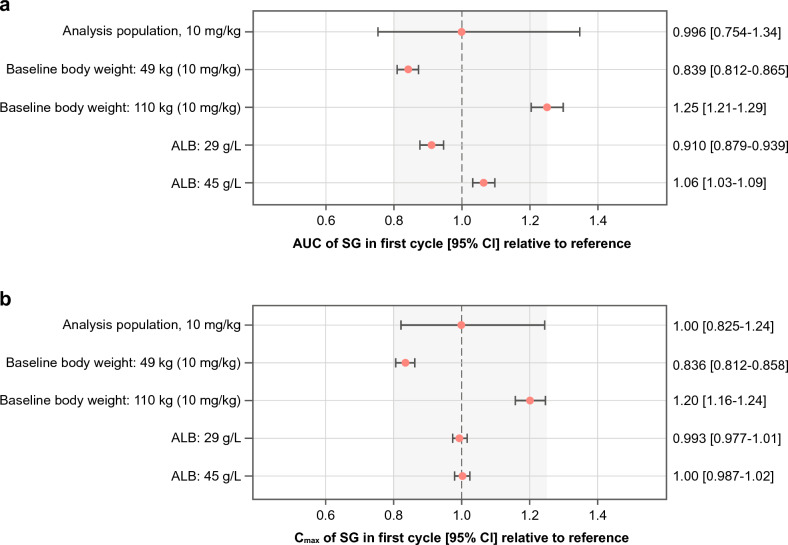
Fig. 3.
Impact of statistically significant covariates identified in the final model on predicted SG AUC (a) and Cmax (b). AUC and Cmax at the given covariate values were compared with those predicted for a typical patient with a body weight of 70 kg and baseline albumin of 38 g/L at the beginning of the study. Dots and error bars show the predicted relative exposure with 95% CI. ALB albumin, AUC area under the serum concentration-time curve, CI confidence interval, Cmax maximum (peak) serum drug concentration, SG sacituzumab govitecan

