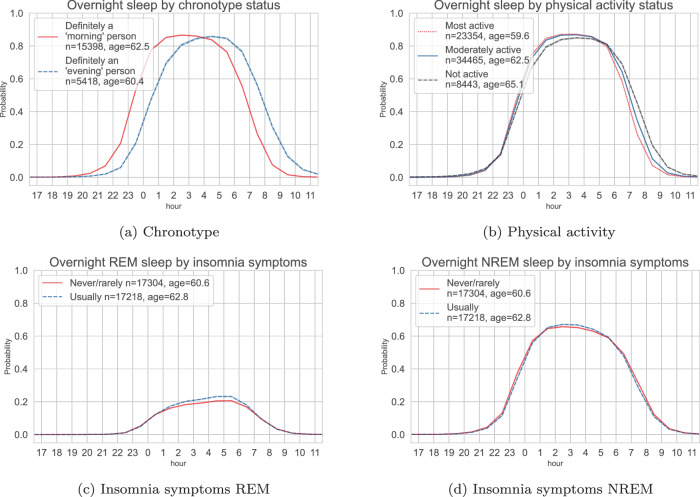
Fig. 3. Device-measured sleep probability trajectories throughout the day for the UK Biobank participants.
Top: variations of the average overnight sleep probability for the participants with self-reported ‘morning’ and ‘evening’ chronotype (a) and the overnight sleep distributions across thirds of device-measured physical activity level (b). Bottom: variations of the average REM (c) and NREM (d) probability in participants with a history of self-reported insomnia symptoms versus those without. REM rapid-eye-movement sleep, NREM non-rapid-eye-movement sleep.

