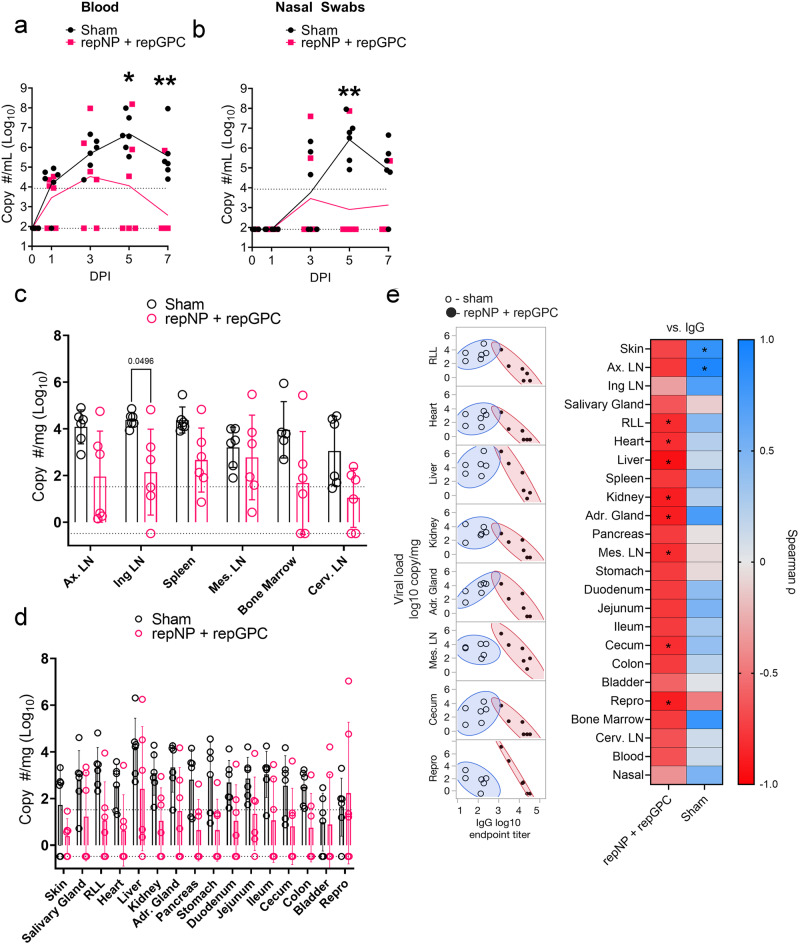
Fig. 3. Protection in RM correlates with CCHFV-specific IgG.
Viral RNA in the blood (a), nasal swabs (b), lymphoid tissues (c), and non-lymphoid tissues (d) was quantified using qRT-PCR. Upper dashed line indicates the limit of quantitation, and the lower dashed line indicates the limit of detection. e Spearman correlation between antibody endpoint titers at time of challenge (Day 0 PI) and viral loads at time of necropsy (Day 7 PI) or area under the curve for blood and nasal swab. Tissues with significant correlation are shown in the left panel, and coefficients for all tissues are shown in the right panel. a–d P values calculated using a two-way ANOVA with Sidak’s multiple comparisons test, and comparisons with P > 0.05 are not shown. e P values calculated using Spearman correlation. *P < 0.05, **P < 0.01. c, d Bar shows mean with error bars representing standard deviation.

