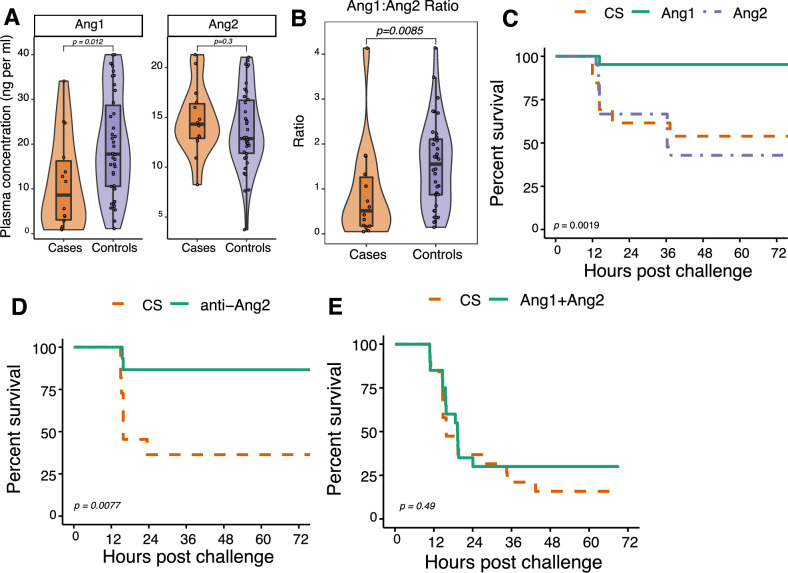
Figure 1.
Ang/TIE signaling is associated with neonatal sepsis. (A) Plasma Ang1 (left panel) and Ang2 (right panel) levels in human infants with LOS (sPLA-2/Ang sepsis cohort; n = 22 infants with n = 31 samplings) or with no LOS (n = 40 infants with n = 43 samples) as measured by ELISA (Wilcoxon rank-sum with median and 95% CI). (B) Plasma Ang1/Ang2 ratio in human infants with LOS vs without LOS, as measured by ELISA (Wilcoxon rank-sum). (C) Overall survival of cecal slurry (CS)-challenged mice after prophylactic administration of exogenous Ang1 or Ang2 (n = 21 per group, derived from two independent experiments; p = 0.0019, log-rank). (D) Overall survival of CS-challenged mice after prophylactic administration of anti-Ang2 blocking antibody (n = 11–15 mice per group, derived from two independent experiments; p = 0.0077, log-rank). (E) Overall survival of CS-challenged mice treated with either saline (CS) or Ang1 plus Ang2 (Ang1 + Ang2) one hour prior to CS challenge (n = 19–20 per group, derived from two independent experiments; p = 0.493, log rank). Violin plots use a combination a boxplot and a kernel density curve to show the distribution of data. The upper and lower bounds of the boxplot indicate the first and third quartiles, respectively, with the median displayed by a horizontal line; whiskers extend no further than 1.5 × the interquartile range from the hinge.

