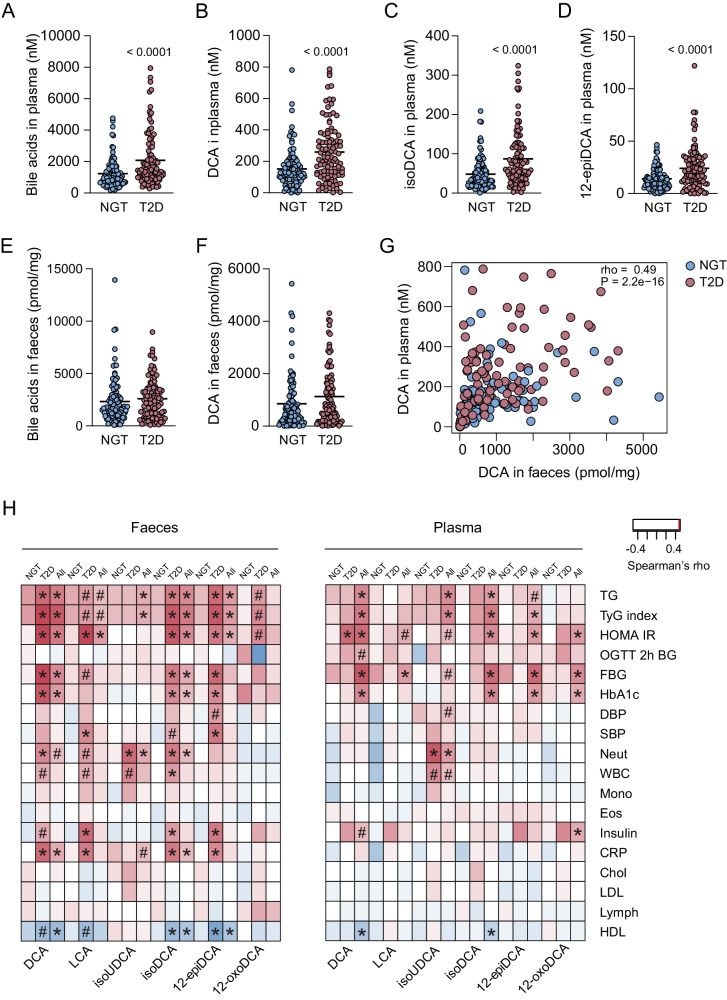
Fig. 3. Increased levels of DCA in plasma from T2D individuals.
A–D Plasma levels of total bile acids (A), DCA (B), isoDCA (C) and 12-epiDCA (D) in NGT and T2D individuals. E, F Faecal levels of total bile acids (E) and DCA (F) in NGT controls and T2D individuals. G, H Spearman’s correlation analysis between DCA levels in plasma and faeces (G) and between DCA, LCA, isoUDCA, isoDCA, 12-epiDCA and 12-oxoDCA in faeces or plasma and clinical parameters (H). For (A–F), mean with all points are plotted; n = 100 samples/group; P-values indicate differences between the NGT (blue color) and T2D (pink color) groups analyzed with two-tailed Mann–Whitney using Benjamini and Hochberg adjusted p-values. For H, red color indicates positive correlation and blue color indicate negative correlation and *P < 0.05, #P < 0.01 are indicated using Benjamini and Hochberg adjusted p-values. Chol cholesterol, CRP C-reactive protein, DBP diastolic blood pressure, DCA deoxycholic acid, Eos eosinophils, FBG fasting blood glucose, HbA1c Hemoglobin A1c, HDL high-density lipoprotein, HOMA-IR Homeostatic Model Assessment for Insulin Resistance, isoDCA iso-deoxycholic acid, isoUDCA iso-ursodeoxycholic acid, LCA lithocholic acid, LDL low-density lipoprotein, Lymph lymphocytes, Mono monocytes, NGT normal glucose tolerance, Neut neutrophils, OGTT 2 h BG blood glucose at 2 h after oral glucose tolerance test, SBP systolic blood pressure, T2D Type 2 diabetes, TG triglycerides, TyG triglyceride-glucose index, WBC white blood cells, 12-epiDCA 12-epideoxycholic acid, 12-oxoDCA 12-oxodeoxycholic acid.

