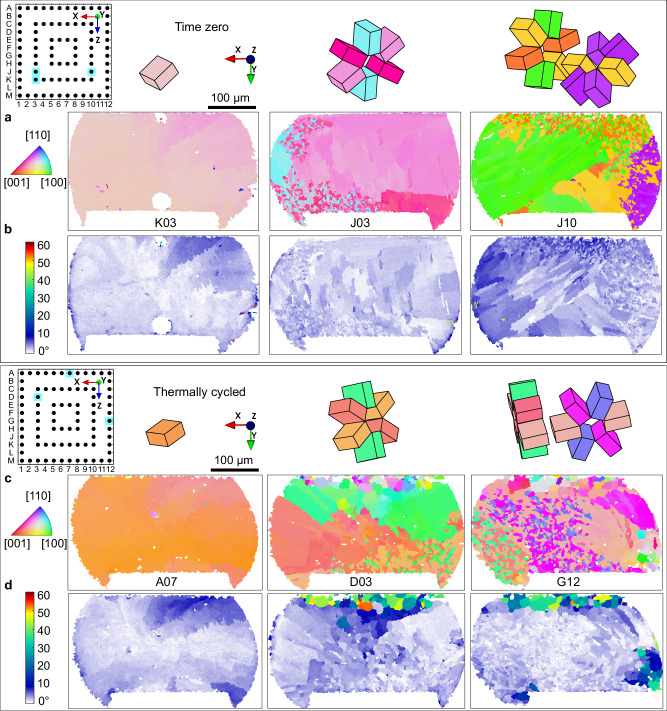
Fig. 2. Typical solder joint microstructures in the 84CTBGA before and after thermal cycling.
a, b Time-zero, c, d after 7580 thermal cycles from 0/100 °C. a, c EBSD orientation maps (IPF-Y) and Sn unit cell wireframes translated to highlight the cyclic twins. b, d EBSD misorientation maps with reference to the major Sn orientation(s). Pin diagrams indicate the locations of each joint in the array and labels of selected joints are marked under EBSD maps.

