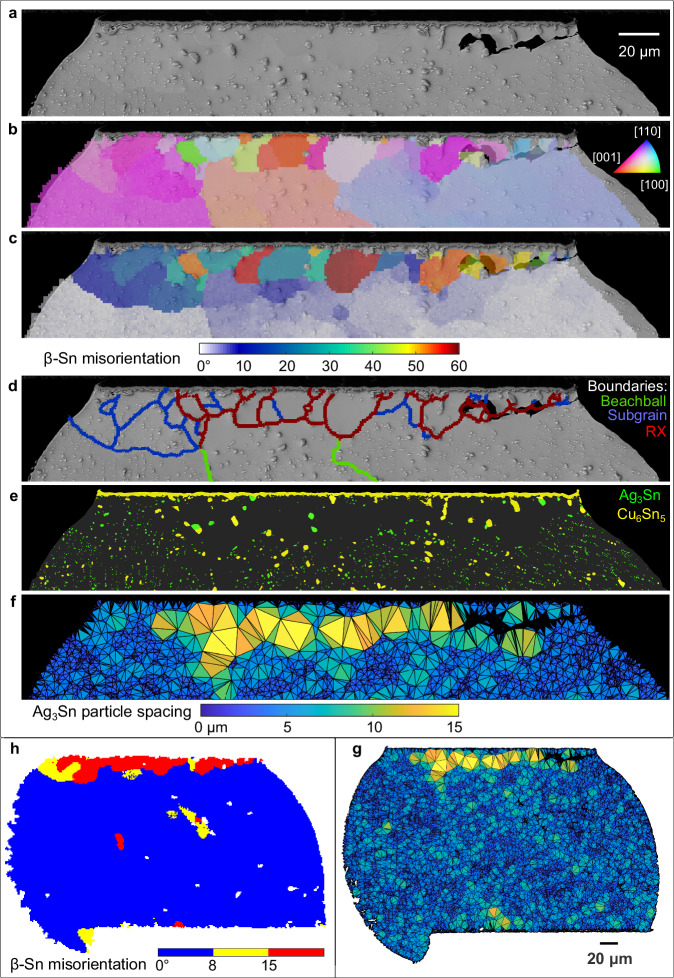
Fig. 4. Typical features of microstructure and damage evolution due to thermal cycling using joint G08 as an example.
a BSE-SEM image near the top of the joint, b EBSD orientation map with IPF-X colouring, c misorientation map with reference to the as-solidified major Sn orientations, d grain boundary segments categorised by misorientation: 5–15° = subgrains; >15° = recrystallised grain boundaries, e IMC layer and particle segmentation, f, g Ag3Sn particle spacing maps generated with a Delaunay triangulation of all measured Ag3Sn particle centroids. h Misorientation map using threshold ranges of 15° > MO > 8° and MO > 15°.

