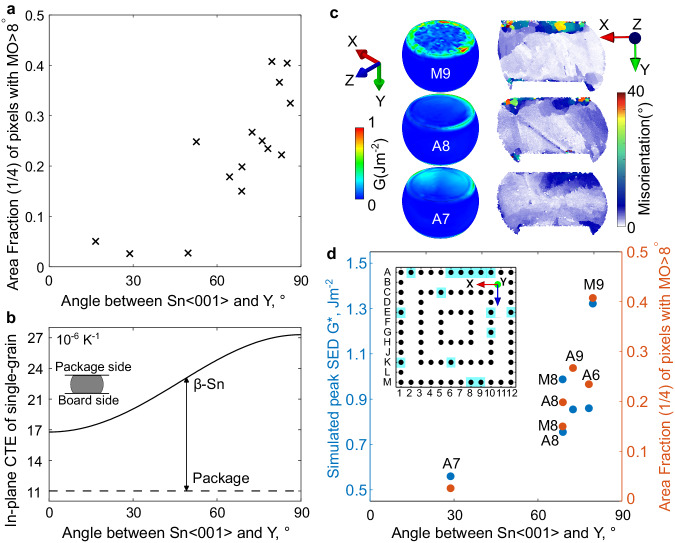
Fig. 6. Influence of tin grain orientation on the experimental damage and simulated stored energy density (SED) for single grain joints.
a Measured area fraction with MO > 8° versus the angle between Sn〈001〉 and Y for all 15 single grain joints studied. b Calculated connection between in-plane CTE and the angle between Sn〈001〉 and Y, compared with the in-plane CTE of the package. c Simulated 3D SED distribution and measured misorientation distribution in the 2D cross-section of three joints. d Correlation between simulated peak SED and experimental area fraction with MO > 8°.

