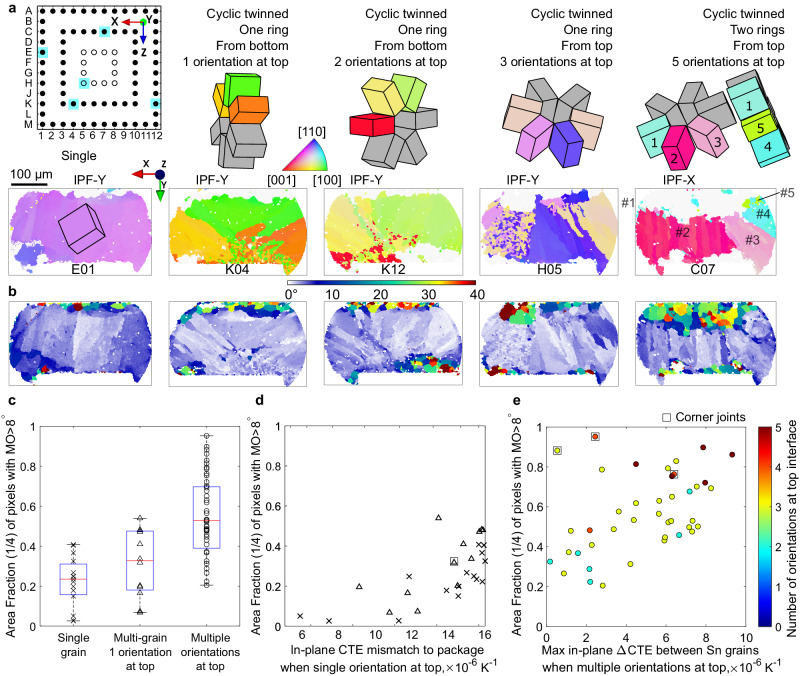
Fig. 7. EBSD and damage analysis of typical microstructures.
a, b Five examples spanning the range of microstructures observed after thermal cycling: (a) Sn IPF orientation maps with MO > 8° removed and measured unit cell wireframes, (b) misorientation maps defined with reference to the original major Sn orientations. c Damage area fraction values for different types of microstructure. d Area fraction with MO > 8° increases with in-plane CTE mismatch to package when single orientation at top (based on experimental 2D sections). e Area fraction with MO > 8° increases with increasing maximum in-plane ∆CTE between Sn grains when multiple original orientations at top.

