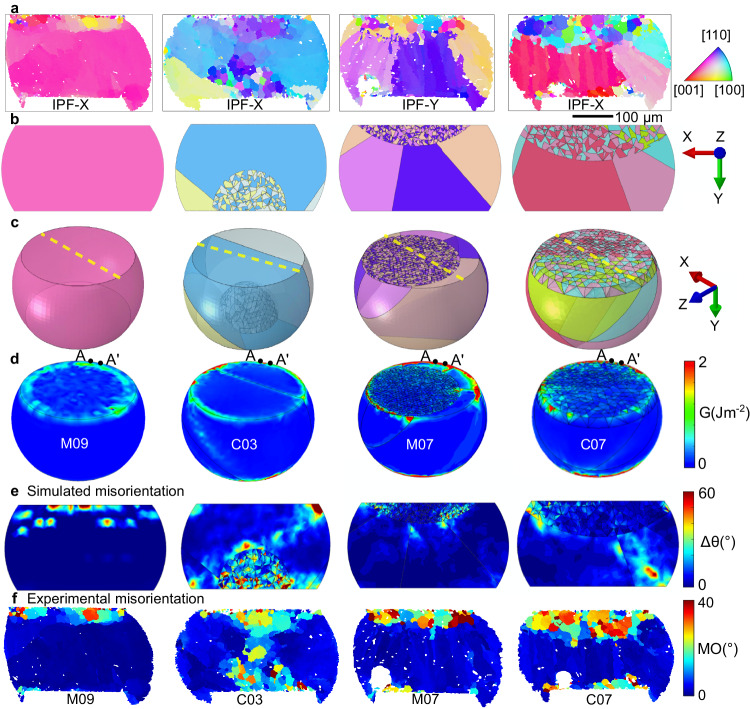
Fig. 9. Direct comparison between experimentally measured microstructure and damage and the multi-scale thermal cycling model of the same joints.
a Experimental EBSD IPF orientation maps after thermal cycling. b, c 3D geometrical models before thermal cycling, input into the CPFE model. Yellow dashed lines in (c) are the sectioned planes in (b) which are at the same location as in (a). d Simulated stored energy density distribution after 10 cycles. e Simulated misorientation distribution after the 10 cycles. f Experimental misorientation distribution after 7580 thermal cycles. a, f are experimental results. b–e are CPFE modelling.

