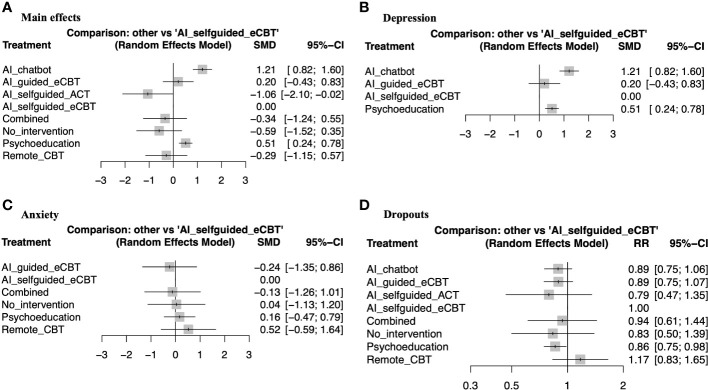
Figure 4.
Forest plots of network meta-analysis of RCTs. (A) Main effects of all the included RCTs (n=6), (B) Interventions specific for the management of depression symptoms (n=4), (C) Interventions specific for the management of anxiety symptoms (n=4), (D) RCTs reporting participant dropouts (n=6).

