Figure 2.
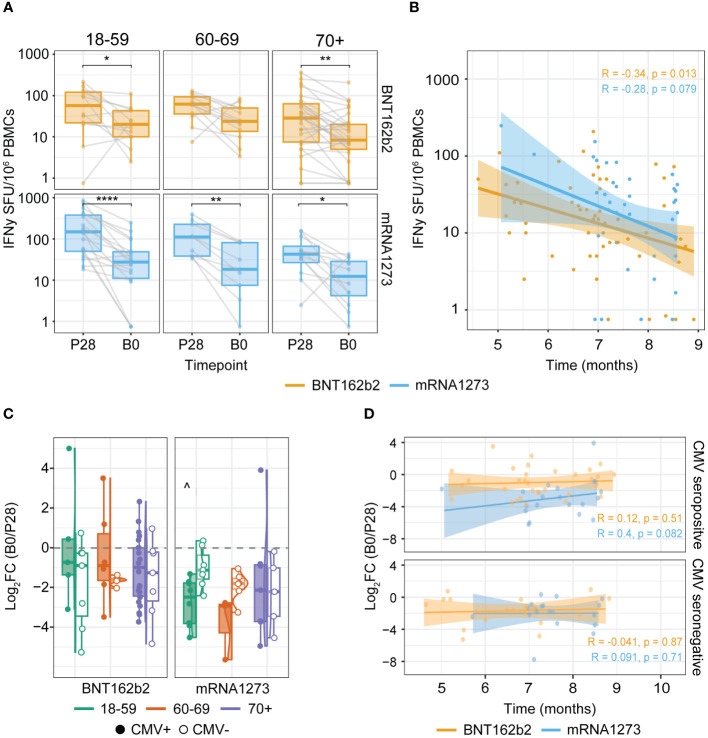
Spike-specific IFNγ T cell responses wane after primary vaccination but remain detectable up to at least nine months. (A, B) IFNγ T cell ELISpot response at timepoints P28 and B0 (1 and 4-9 months after completing the primary COVID-19 vaccination series respectively). (C, D) Change in the Spike-specific IFNγ T cell response between P28 and B0 defined by the log2 fold change (log2FC) of B0/P28. (A) Waning of Spike-specific T cell responses upon primary BNT162b2 or mRNA-1273 vaccination per age group. *p<0.05; **p<0.01; ****p<0.0001 paired Wilcoxon test. (B) Spearman correlation of the Spike-specific T cell response at B0 and the time in months between primary (second dose) and booster vaccination. (C) Log2FC of B0/P28 Spike-specific T cell response. ^p<0.05 BNT162b2 versus mRNA1273 among 18-59 cytomegalovirus (CMV) seropositive participants. Kruskal-Wallis test and Dunn’s test with Benjamin-Hochberg adjustment for multiple comparisons. (D) Spearman correlation of the log2FC of B0/P28 Spike-specific T cell response and time in months between the two vaccination dates stratified by CMV serostatus. Correlation coefficients (R) and p-values (p) are given according to the type of mRNA COVID-19 vaccine received (orange: BNT162b2; blue: mRNA-1273). SFU: Spot Forming Units.

